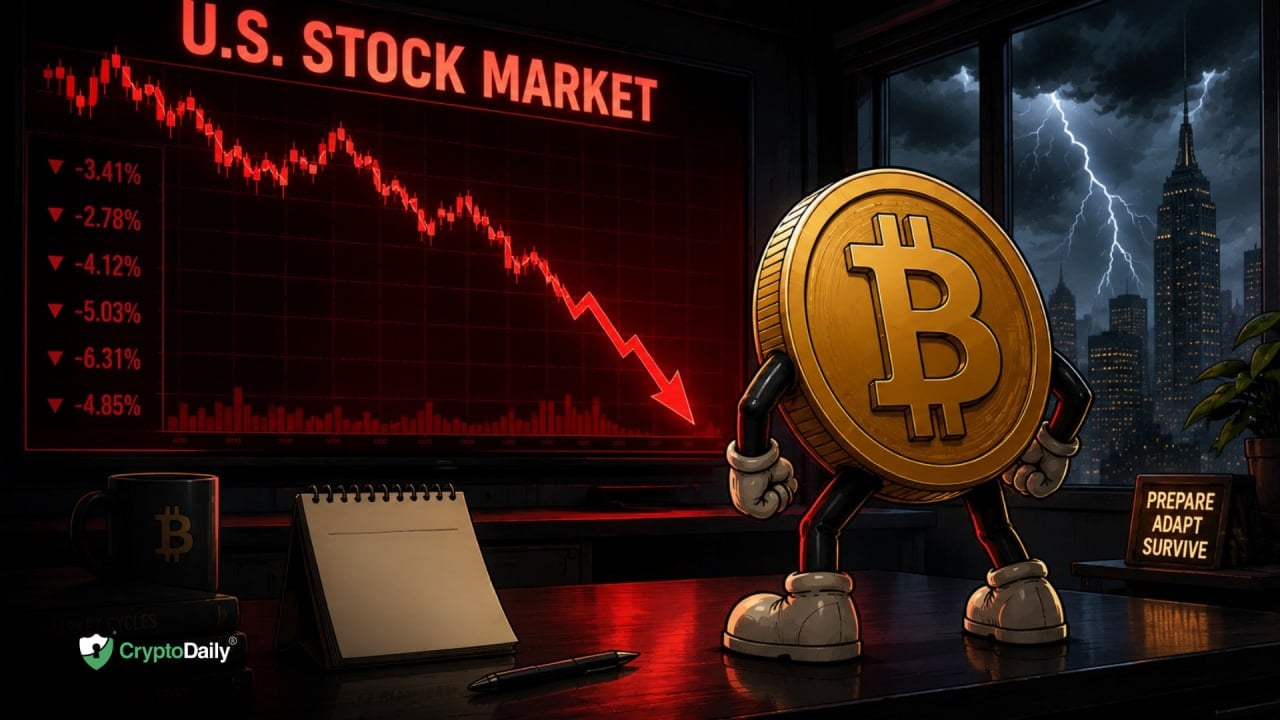
Bitcoin Price Analysis: 16708 Support Tested - 8 December 2022
BTC/USD Tests 16708 Technical Support: Sally Ho’s Technical Analysis – 8 December 2022
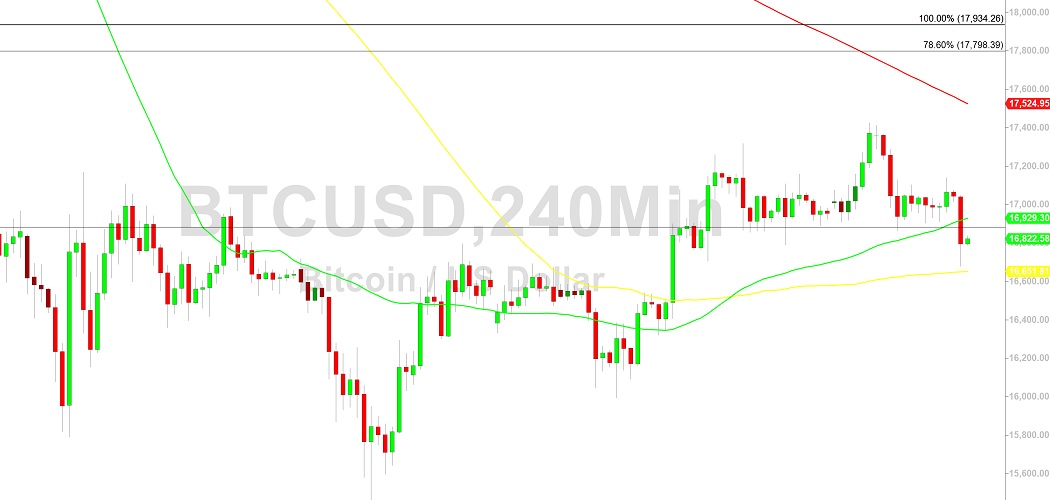
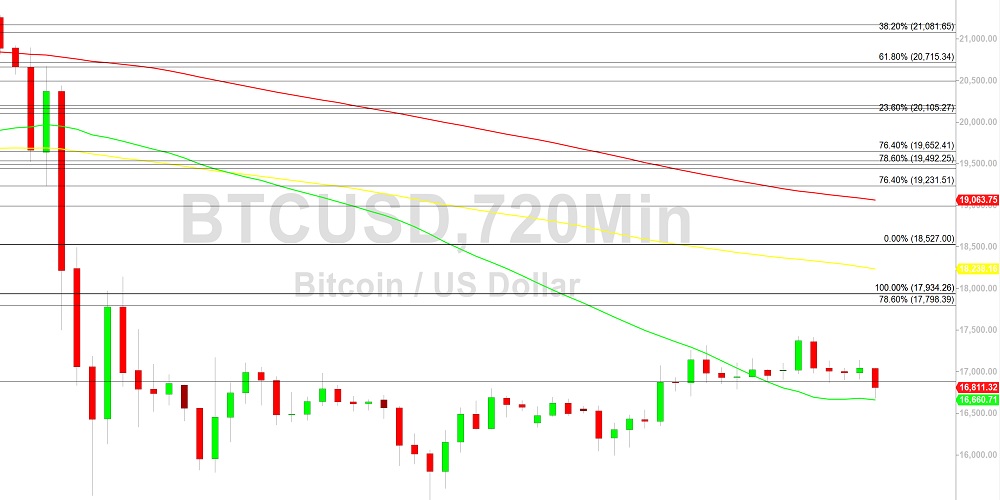
Bitcoin (BTC/USD) continued to moderate early in the Asian session as the pair moved higher after trading as low as the 16679.52 level, representing a test of the 38.2% retracement of the recent appreciating range from 15460 to 17424.59. Stops were elected below the 16877 and 16708 levels during the pullback, representing the 38.2% and 50% retracements of the recent appreciating range from 15992.64 to 17424.59. Additional downside retracement levels in these recent appreciating ranges include the 16539, 16442, 16330, 16299, 16210, 15923, and 15880 levels. If recent downside momentum accelerates, traders may test recent two-year lows around the 15460 level established after Stops were elected below the 15512 area, a previous relative low that represented an exact bearish price objective based on selling pressure that strengthened around the 21478.80 and 18495.50 areas.
Associated downside price objectives below current price activity include the 13369, 8837, and 7538 levels. Technicians continue to eye the 14500.15 and 10432.73 areas as major downside targets, and additional downside price objectives include the 14613, 10727, and 9682 levels, areas that are related to selling pressure that intensified around the 20894.96 and 18495.50 areas. If BTC/USD is able to resume its upward trajectory, upside areas of potential technical resistance and selling pressure include the 17791, 18495, 19199, 20070, and 20201 levels. Traders are observing that the 50-bar MA (4-hourly) is bearishly indicating below the 200-bar MA (4-hourly) and above the 100-bar MA (4-hourly). Also, the 50-bar MA (hourly) is bearishly indicating below the 100-bar MA (hourly) and above the 200-bar MA (hourly).
Price activity is nearest the 100-bar MA (4-hourly) at 16651.77 and the 200-bar MA (Hourly) at 16909.81.
Technical Support is expected around 14500.15/ 13369.11/ 10727.75 with Stops expected below.
Technical Resistance is expected around 18495.40/ 19199.48/ 20070.64 with Stops expected above.
On 4-Hourly chart, SlowK is Bearishly below SlowD while MACD is Bearishly below MACDAverage.
On 60-minute chart, SlowK is Bullishly above SlowD while MACD is Bearishly below MACDAverage.
Disclaimer: Sally Ho’s Technical Analysis is provided by a third party, and for informational purposes only. It does not reflect the views of Crypto Daily, nor is it intended to be used as legal, tax, investment, or financial advice.

Related Stories