Bitcoin Price Analysis: Gunning for 17231 - 25 November 2022
BTC/USD Bulls Looking for More: Sally Ho’s Technical Analysis – 25 November 2022
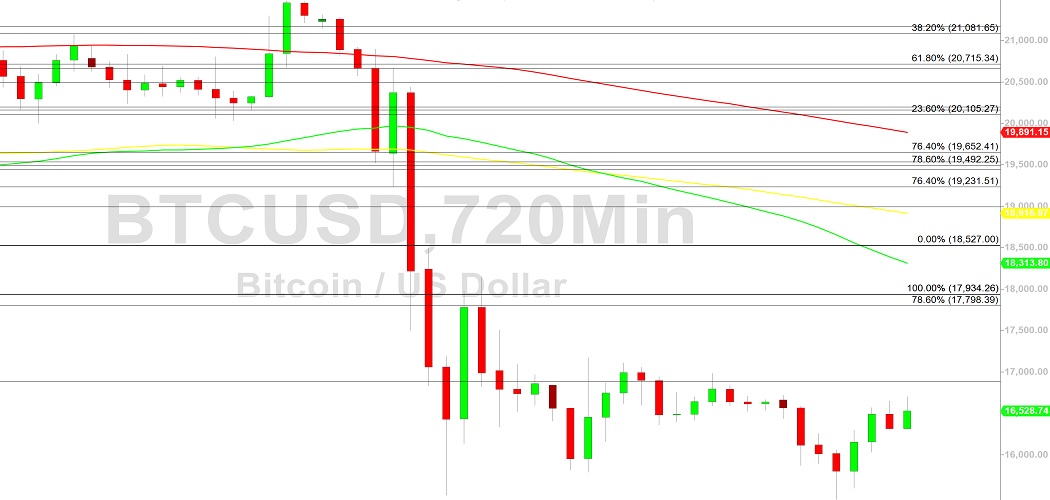
Bitcoin (BTC/USD) looked to resume its recent upward trajectory early in the Asian session as the pair recently bounced higher from the 16301.50 level before escalating to the 16700 area. Stops were recently elected above the 16088 and 16222 levels, representing the 50% retracements of the recent depreciating ranges from the 16984.08 and 16717.86 levels. Additional Stops were also triggered above the 16401, 16448, and 16657 areas, additional retracement levels related to the depreciating ranges. BTC/USD recently depreciated to the 15460 level after Stops were elected below the 15512 area, its recent two-year low that represented an exact bearish price objective based on selling pressure that strengthened around the 21478.80 and 18495.50 areas. Associated downside price objectives below current price activity include the 13369, 8837, and 7538 levels.
The recent depreciation intensified after Stops were elected below the 16990, 16966, and 16503 levels, areas associated with historical appreciating ranges that commenced around the 3858 and 9819 levels. Technicians continue to eye the 14500.15 and 10432.73 areas as major downside targets. Additional downside price objectives include the 14613, 10727, and 9682 levels, areas that are related to selling pressure that intensified around the 20894.96 and 18495.50 areas. Following the recent move lower to two-year lows, areas of potential technical resistance include the 17791, 18495, 19199, 20070, and 20201 levels. Traders are observing that the 50-bar MA (4-hourly) is bearishly indicating below the 200-bar MA (4-hourly) and below the 100-bar MA (4-hourly). Also, the 50-bar MA (hourly) is bearishly indicating below the 100-bar MA (hourly) and below the 200-bar MA (hourly).
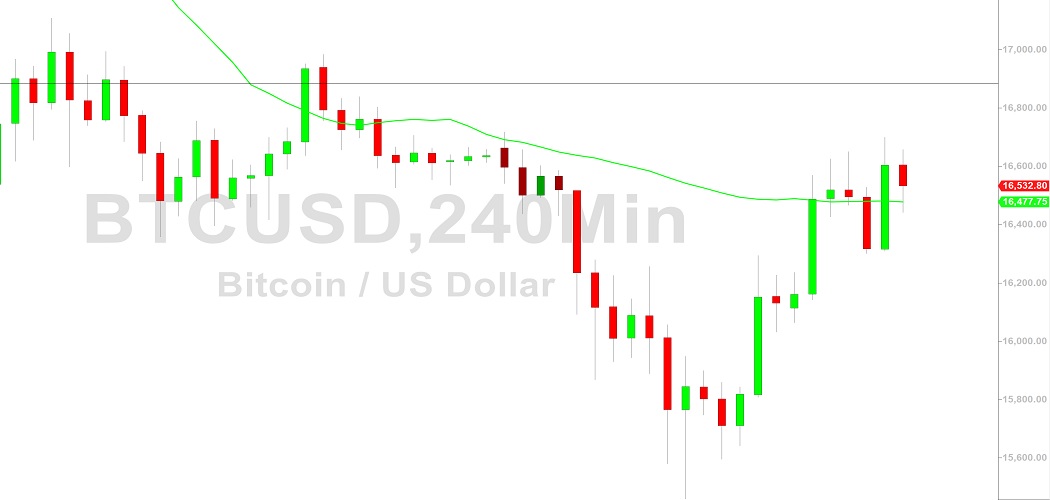
Price activity is nearest the 200-bar MA (4-hourly) at 16476.27 and the 50-bar MA (Hourly) at 16477.57.
Technical Support is expected around 14500.15/ 13369.11/ 10727.75 with Stops expected below.
Technical Resistance is expected around 18495.40/ 19199.48/ 20070.64 with Stops expected above.
On 4-Hourly chart, SlowK is Bullishly above SlowD while MACD is Bearishly below MACDAverage.
On 60-minute chart, SlowK is Bullishly above SlowD while MACD is Bullishly above MACDAverage.
Disclaimer: Sally Ho’s Technical Analysis is provided by a third party, and for informational purposes only. It does not reflect the views of Crypto Daily, nor is it intended to be used as legal, tax, investment, or financial advice.

Related Stories