Bitcoin Price Analysis: BTC Peaks Above 21000 - 31 October 2022
BTC/USD Peaks Above 21000: Sally Ho’s Technical Analysis – 31 October 2022
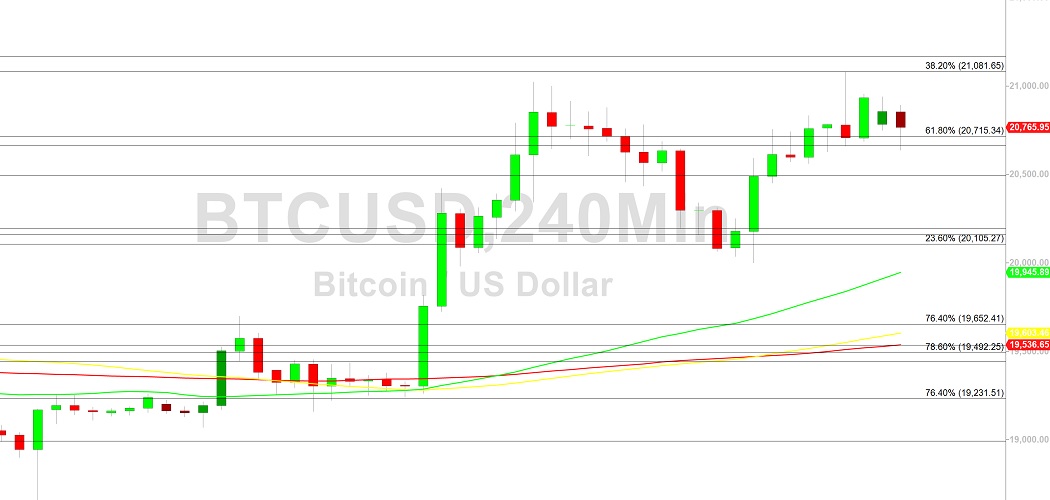
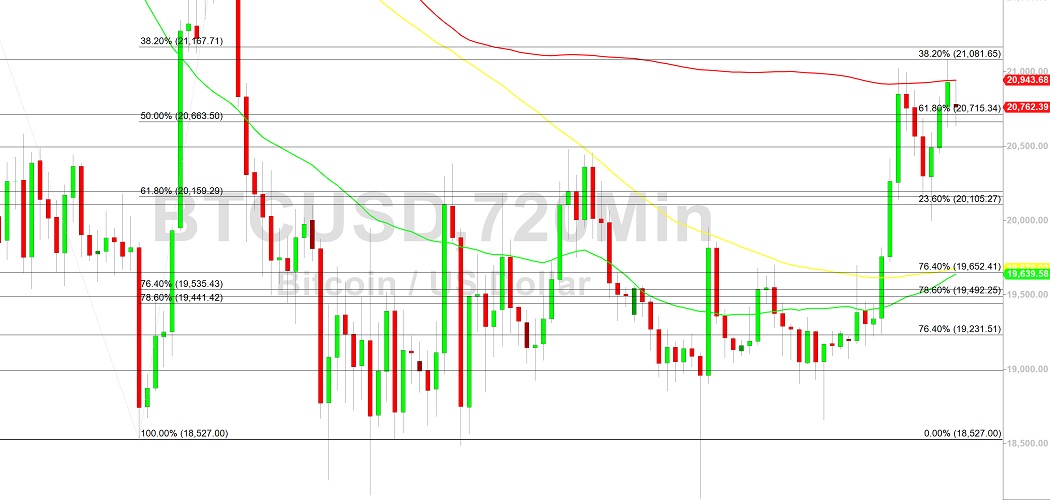
Bitcoin (BTC/USD) maintained positive upside momentum early in the Asian session as the pair sought to reclaim the psychologically-important 21000 figure after recently peaking around the 21080 area, its strongest print since mid-September. This move represented a test of the 61.8% retracement of the depreciating range from 22800 to 18131 and opens up possible tests of additional related retracement areas around the 21698 and 21800 levels. Traders continue to monitor price activity around the 20836.92 area, representing the 38.2% retracement of the broader depreciating range from 25214.57 to 18131. Additional retracement levels in this depreciating range include the 21672, 22508, 23542, and 23698 areas. Following recent upward progress, buying pressure and areas of technical support are expected around the 20509, 20055, 19600, and 18954 areas, with Stops likely below.
BTC/USD bears observe larger Stops accumulating below the 17803, 17701, 16966, and 16503 areas, significant technical levels related to historical upside pressure around the 3858 and 9819 levels. Additional significant technical areas on the downside include the 16990.14, 14500.15, and 10432.73 areas. Stops are accumulating below the 19711 and 19355 areas. Traders are observing that the 50-bar MA (4-hourly) is bullishly indicating above the 100-bar MA (4-hourly) and above the 200-bar MA (4-hourly). Also, the 50-bar MA (hourly) is bullishly indicating above the 100-bar MA (hourly) and above the 200-bar MA (hourly).
Price activity is nearest the 50-bar MA (4-hourly) at 19946.06 and the 50-bar MA (Hourly) at 20572.41.
Technical Support is expected around 16990.14/ 14500.15/ 10432.73 with Stops expected below.
Technical Resistance is expected around 25256.96/ 27455.20/ 32383.96 with Stops expected above.
On 4-Hourly chart, SlowK is Bearishly below SlowD while MACD is Bullishly above MACDAverage.
On 60-minute chart, SlowK is Bearishly below SlowD while MACD is Bearishly below MACDAverage.
Disclaimer: Sally Ho’s Technical Analysis is provided by a third party, and for informational purposes only. It does not reflect the views of Crypto Daily, nor is it intended to be used as legal, tax, investment, or financial advice.

Related Stories