Bitcoin Price Analysis: 20479 in Sight - 7 October 2022
BTC/USD Poised to Challenge 20479: Sally Ho’s Technical Analysis – 7 October 2022
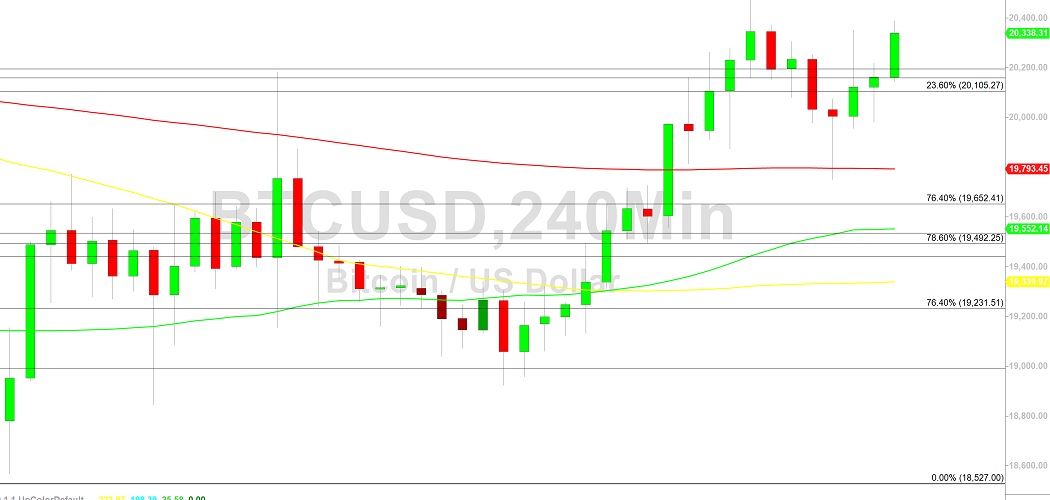
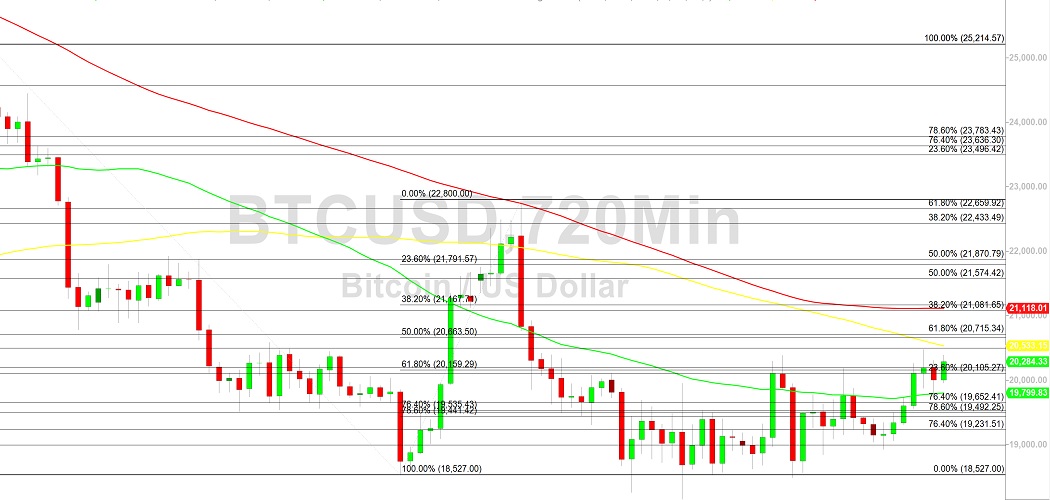
Bitcoin (BTC/USD) remained buoyant early in the Asian session as the pair worked to remain above the 20323.33 level, representing the 78.6% retracement of the depreciating range from 20479.43 to 18750. Recent selling pressure emerged around a multi-session high around the 20479.43 area, representing the 23.6% retracement of the recent appreciating range from 18923.81 to 20479.43 area. Buying pressure was also recently seen around the 19980 area, just below the 50-hour simple moving average. Upside retracement levels in recent depreciating ranges include the 20476, 21024, 21703, and 21805 areas. Following recent selling pressure, BTC/USD bears are eyeing a greater risk of a test of June lows. Following the recent sharp decline, the 20433 area has emerged as an area of consistent technical resistance and is technically related to selling pressure that commenced around the all-time high of 69000.
Below current price activity, traders continue to anticipate large Stops below the 17803, 17701, 16966, and 16503 areas, significant technical levels related to historical upside pressure around the 3858 and 9819 areas. Additional significant technical areas on the downside include the 16990.14, 14500.15, and 10432.73 areas. Above recent price activity, upside retracement levels in the depreciating range from 31549.21 to 17567.45 include the 26208, 28249, and 28557 areas. Additional upside price objectives and areas of potential selling pressure include the 25552, 26323, 26411, 26901, 27126, 27455, 28426, and 29669 areas. Traders are observing that the 50-bar MA (4-hourly) is bearishly indicating below the 200-bar MA (4-hourly) and above the 100-bar MA (4-hourly). Also, the 50-bar MA (hourly) is bullishly indicating above the 100-bar MA (hourly) and above the 200-bar MA (hourly).
Price activity is nearest the 200-bar MA (4-hourly) at 19793.33 and the 50-bar MA (Hourly) at 20052.27.
Technical Support is expected around 16990.14/ 14500.15/ 10432.73 with Stops expected below.
Technical Resistance is expected around 25256.96/ 27455.20/ 32383.96 with Stops expected above.
On 4-Hourly chart, SlowK is Bullishly above SlowD while MACD is Bullishly above MACDAverage.
On 60-minute chart, SlowK is Bullishly above SlowD while MACD is Bullishly above MACDAverage.
Disclaimer: Sally Ho’s Technical Analysis is provided by a third party, and for informational purposes only. It does not reflect the views of Crypto Daily, nor is it intended to be used as legal, tax, investment, or financial advice.

Related Stories