Bitcoin (BTC) to USDT chart over the 4 hour timeframe on 05.09.2022
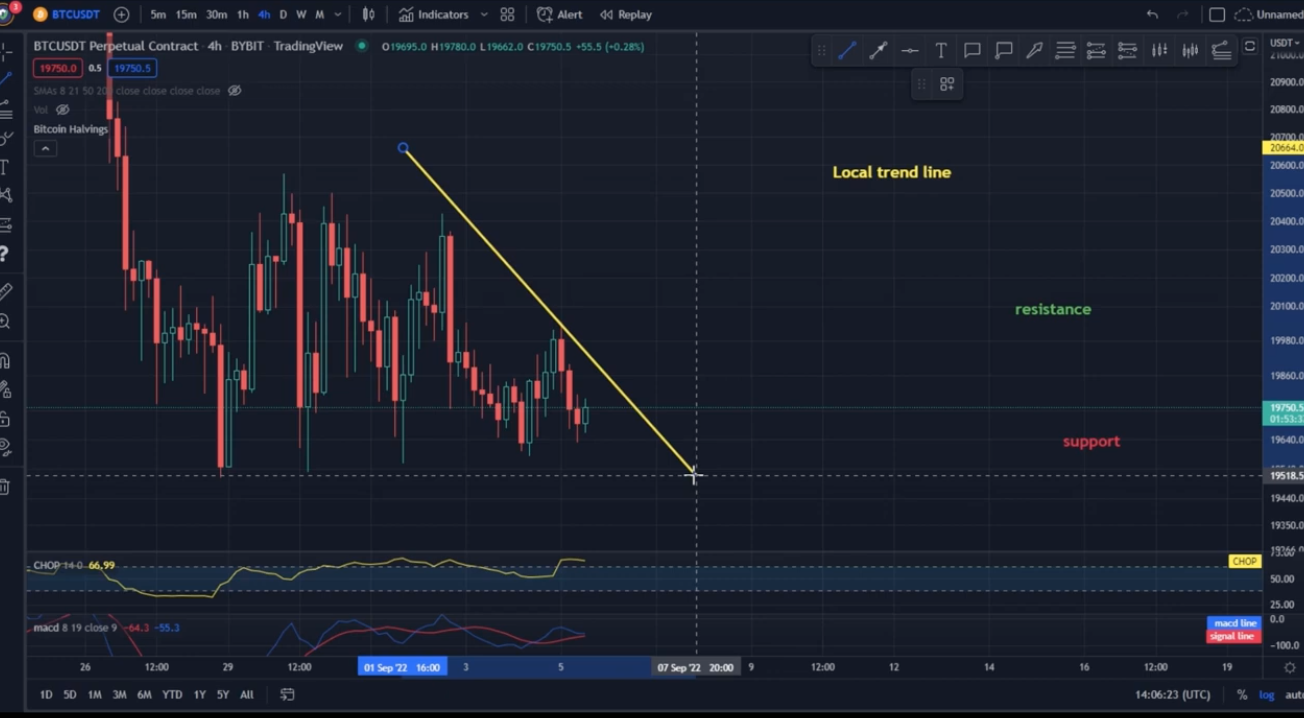
Hello everyone, let's take a look at the BTC to USDT chart over the 4 hour timeframe on 5.09.2022. As you can see, the price is moving below the local downtrend line.
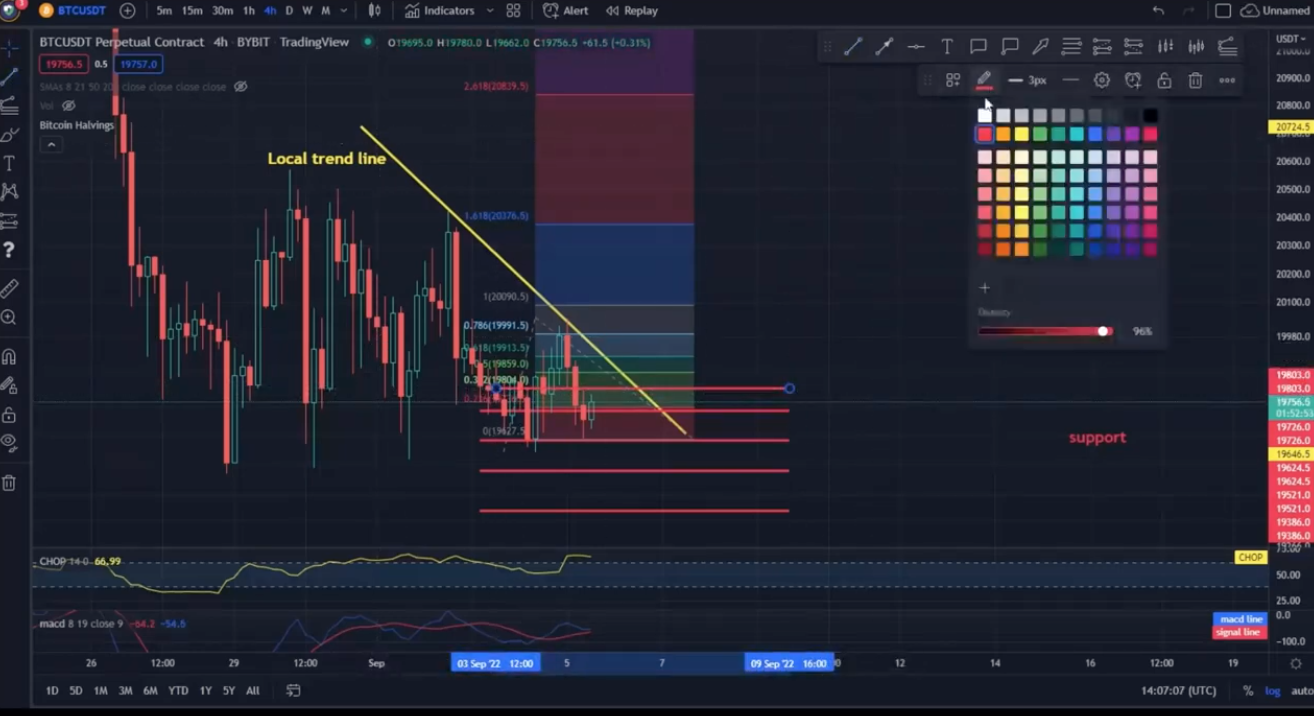
Let's start with the designation of the support line and as you can see the first support in the near future is $ 19,726, if the support breaks down, the next support is $ 19,624, $ 19,521 and $ 19,386.
Now let's move from the resistance line, as you can see, the first resistance is $ 19803, if you can break it, the next resistance will be $ 19,888, $ 19,916 and $ 19,994.
Looking at the CHOP indicator, we can see that we have a lot of energy in the 4-hour interval, and the MACD indicator shows a local upward trend.
Disclaimer: This Technical Analysis is provided by a third party, and for informational purposes only. It does not reflect the views of Crypto Daily, nor is it intended to be used as legal, tax, investment, or financial advice.

Related Stories