BTC/USD Extends Gradual Recovery: Sally Ho’s Technical Analysis – 22 August 2022
Bitcoin
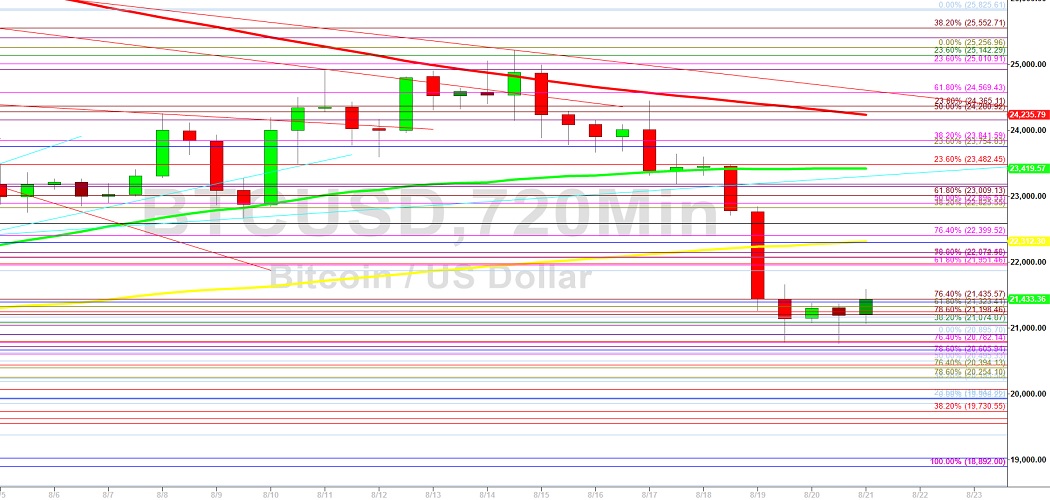
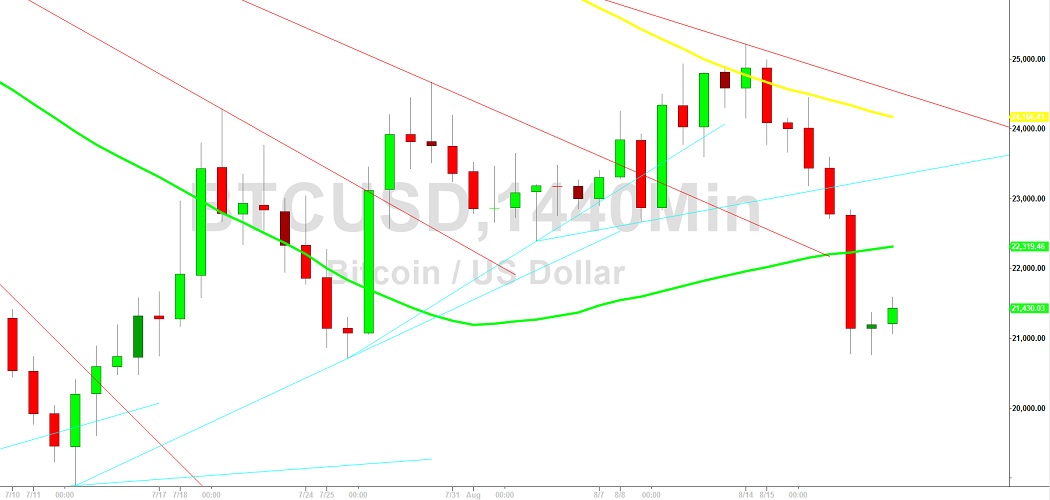
Bitcoin (BTC/USD) added to its recent slight recovery early in the Asian session as the pair gained ground to the 21587.88 area after recently trading as low as the 20760.93 area, with the interday high representing a test of the 23.6% retracement of the depreciating range from 24448.49 to 20760.93. Stops were elected above the 21430 area during the ascent, an area that represents the 23.6% retracement of the recent depreciating range from 23600 to 20760.93. Some Stops were recently elected below the 20867 area during the ongoing descent, a level that represents the 23.6% retracement of the broad depreciating range from 31549.21 to 17567.45. Stops were also recently elected below the 23185, 22296, and 21392 areas during the pullback, technically significant areas related to buying pressure that emerged around the 17567.45 area. Stops are likely in place below the 20443 area, levels that are linked to more recent buying pressure around the 18892 area.
Upside retracement levels in the depreciating range from 31549.21 to 17567.45 include the 26208, 28249, and 28557 areas. Additional upside price objectives and areas of potential selling pressures include the 25552, 26323, 26411, 26901, 27126, 27455, 28426, and 29669 areas. Additional significant technical areas on the downside include the 16990.14, 14500.15, and 10432.73 areas. Traders are observing that the 50-bar MA (4-hourly) is bearishly indicating below the 100-bar MA (4-hourly) and above the 200-bar MA (4-hourly). Also, the 50-bar MA (hourly) is bearishly indicating below the 100-bar MA (hourly) and below the 200-bar MA (hourly).
Price activity is nearest the 200-bar MA (4-hourly) at 23149.81 and the 50-bar MA (Hourly) at 21237.21.
Technical Support is expected around 16990.14/ 14500.15/ 10432.73 with Stops expected below.
Technical Resistance is expected around 25256.96/ 27455.20/ 32383.96 with Stops expected above.
On 4-Hourly chart, SlowK is Bullishly above SlowD while MACD is Bullishly above MACDAverage.
On 60-minute chart, SlowK is Bearishly below SlowD while MACD is Bullishly above MACDAverage.
Disclaimer: Sally Ho’s Technical Analysis is provided by a third party, and for informational purposes only. It does not reflect the views of Crypto Daily, nor is it intended to be used as legal, tax, investment, or financial advice.