BTC/USD Bulls Eye 42986 as Key Level: Sally Ho's Technical Analysis 7 February 2022 BTC
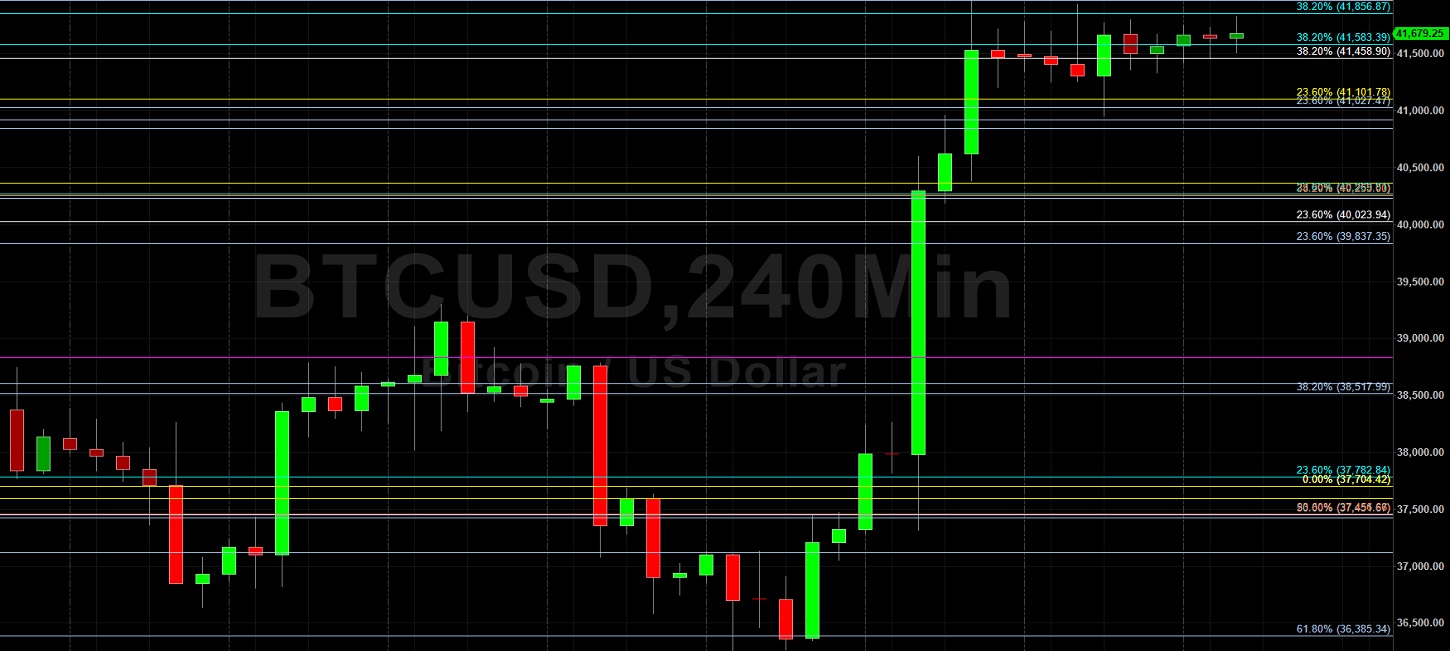
Bitcoin (BTC/USD) attempted to add to recent upside progress early in today’s Asian session as the pair eyed the 42986.21 area, representing the 38.2% retracement of the depreciating range from 59249.77 to 39233.33. Stops were recently elected above the 39144.01 area, representing the 23.6% retracement of the same depreciating range, and additional upside price retracement levels include the 46091, 49196, 53039, and 53618 levels. Additional Stops were also elected above the 37456 and 40255 areas during the recent ascent, representing the 23.6% and 38.2% retracements of the depreciating range from 52100 to 32933.33. Additional upside retracement levels in this depreciating range include the 42516, 44778, 47576, and 47998 areas.
Areas of technical resistance and potential selling pressure include the 42544, 43132, 43211, 43778, 44655, 45213, 46219, 46487, 46600, 47726, and 48135 levels. One downside price objective related to selling pressure around the 52100 and 47076.55 levels is the 28625.93 area. Stops are likely in place below the 31639.47 area, a downside price objective related to selling pressure that intensified around the 57670.68 area. Additional downside price objectives include the 29514, 27721, 25839, and 25217 levels. Traders are observing that the 50-bar MA (4-hourly) is bearishly indicating below the 200-bar MA (4-hourly) and above the 100-bar MA (4-hourly). Also, the 50-bar MA (hourly) is bullishly indicating above the 100-bar MA (hourly) and above the 200-bar MA (hourly).
Price activity is nearest the 200-bar MA (4-hourly) at 40370.39 and the 50-bar MA (Hourly) at 39244.78.
Technical Support is expected around 31639.47/ 29514.02/ 27271.02 with Stops expected below.
Technical Resistance is expected around 42544.70/ 43132.91/ 44763.46 with Stops expected above.
On 4-Hourly chart, SlowK is Bearishly below SlowD while MACD is Bullishly above MACDAverage.
On 60-minute chart, SlowK is Bearishly below SlowD while MACD is Bearishly below MACDAverage.
Disclaimer: This trading analysis is provided by a third party, and for informational purposes only. It does not reflect the views of Crypto Daily, nor is it intended to be used as legal, tax, investment, or financial advice.

Related Stories