BTC/USD Bears Test Key 34190 Level: Sally Ho's Technical Analysis 25 February 2022 BTC
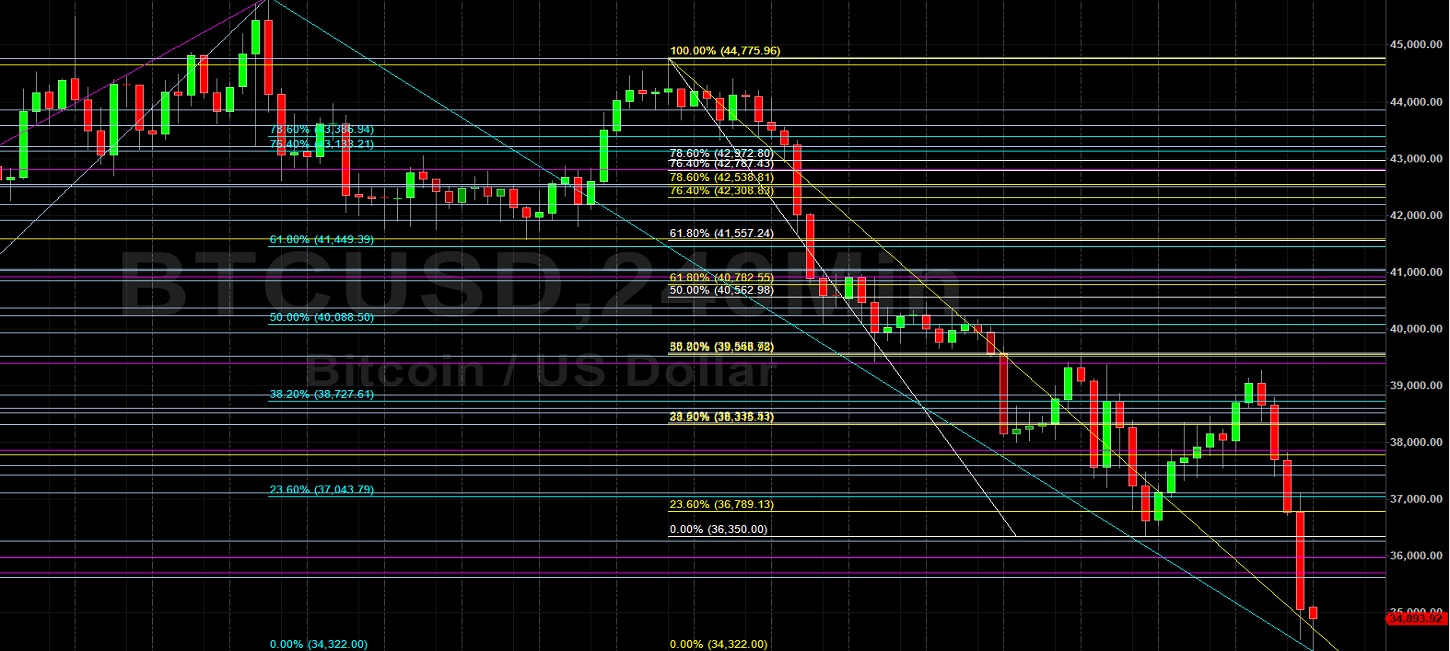
Bitcoin (BTC/USD) remained pressured below the psychologically-important 40000 figure early in the Asian session as the pair sank to its lowest level since late January. Stops were elected below the 35982 and 35698 levels during the sharp depreciation, areas that represent the 76.4% and 78.6% retracements of the appreciating range from 32933.33 to 45855. Stops were also elected below the 35626 area, a major downside price objective related to selling pressure around the 52100 and 48574.70 levels. Major Stops were also elected below the 38670 and 37797 levels during the decline, representing the 76.4% and 78.6% retracements of the historical appreciating range from 29301.56 to 69000.
Buying pressure emerged after BTC/USD tested the 34165 area, a downside price objective related to selling pressure around the 47076 level. If BTC/USD extends its recent move downward, additional downside price objectives and areas of potential technical support include the 34190, 33724, 33208, 32894, 31639, 29514, 28625, 27721, 25839, and 25217 levels. If BTC/USD retraces higher, areas of technical resistance and potential selling pressure include the 35491, 36214, 36789, 37043, 38315, 38727, and 39276 levels. Traders are observing that the 50-bar MA (4-hourly) is bearishly indicating below the 100-bar MA (4-hourly) and below the 200-bar MA (4-hourly). Also, the 50-bar MA (hourly) is bearishly indicating below the 100-bar MA (hourly) and below the 200-bar MA (hourly).
Price activity is nearest the 50-bar MA (4-hourly) at 39709.13 and the 50-bar MA (Hourly) at 37575.08.
Technical Support is expected around 31639.47/ 29514.02/ 27271.02 with Stops expected below.
Technical Resistance is expected around 46600.89/ 47726.76/ 49019.35 with Stops expected above.
On 4-Hourly chart, SlowK is Bearishly below SlowD while MACD is Bearishly below MACDAverage.
On 60-minute chart, SlowK is Bullishly above SlowD while MACD is Bearishly below MACDAverage.
Disclaimer: This trading analysis is provided by a third party, and for informational purposes only. It does not reflect the views of Crypto Daily, nor is it intended to be used as legal, tax, investment, or financial advice.

Related Stories