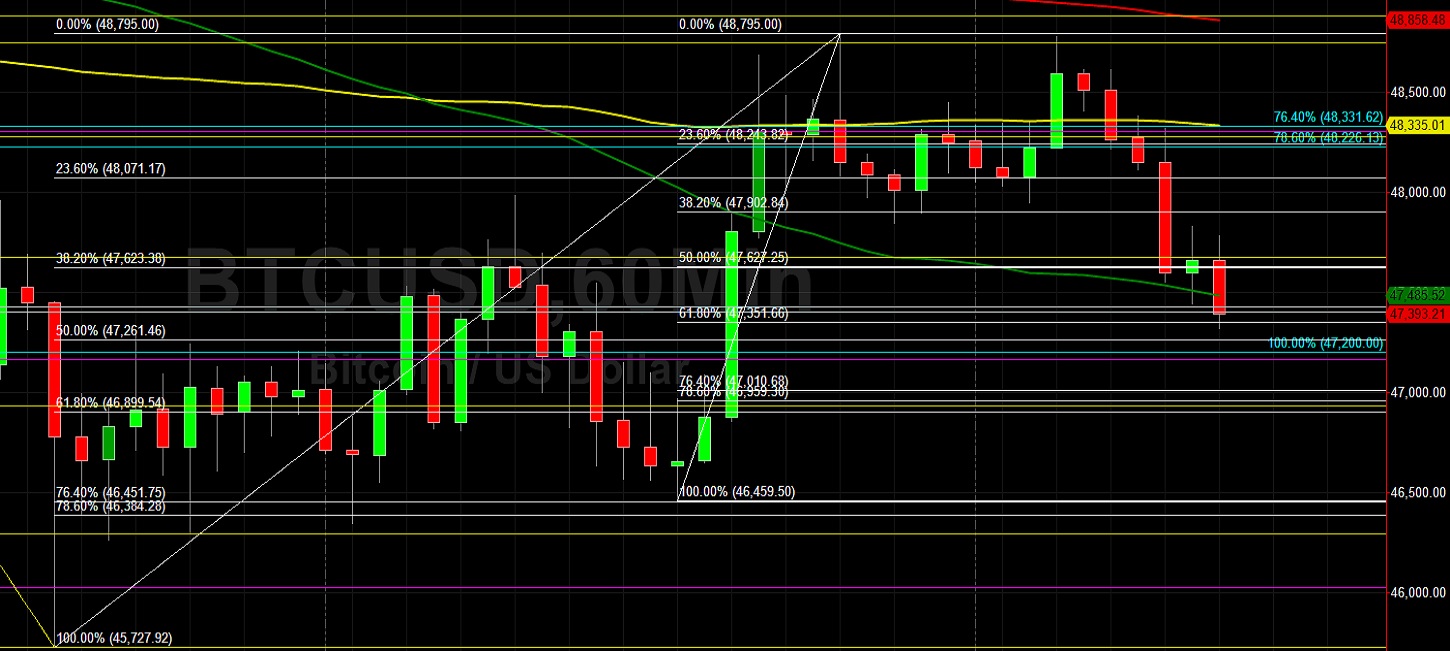
Bitcoin (BTC/USD) was sluggish early in the Asian session as the pair depreciated to the 47444.44 level after trading as high as the 48775.74 level during the European session, with the intraday high representing a test of a downside price objective related to selling pressure from the 59118.84 area, and also representing a test of the 61.8% retracement of the depreciating range from 50828.13 to 45727.92. Bids that emerged during the North American session around the interday low represented a test of the 61.8% retracement of the recent appreciating range from 46459.50 to 48795. Selling pressure commenced around the 59114.84 level in recent weeks and many Stops were elected below downside price objectives during the selling pressure, including the 56533, 56080, 55735, 54295, 54114, 53748, 53600, 53046, 52351, 51322, 51171, 50185, 49361, 47400, 47426, 44974, and 44667 levels.
If BTC/USD extends its recent weakness lower, additional downside price objectives include the 44974, 44667, 42333, 41252, 41053, and 35734 levels. Following the pair’s recent volatility, upside retracement levels and areas of potential technical resistance include the 52706.65, 55157.38, and 55526.67 areas. Traders are observing that the 50-bar MA (4-hourly) is bearishly indicating below the 100-bar MA (4-hourly) and below the 200-bar MA (4-hourly). Also, the 50-bar MA (hourly) is bearishly indicating below the 100-bar MA (hourly) and below the 200-bar MA (hourly).
Price activity is nearest the 50-bar MA (4-hourly) at 48833.43 and the 50-bar MA (Hourly) at 47486.22.
Technical Support is expected around 42151.91/ 38670.39/ 35734.12 with Stops expected below.
Technical Resistance is expected around 52706.65/ 55157.38/ 55526.67 with Stops expected above.
On 4-Hourly chart, SlowK is Bullishly above SlowD while MACD is Bullishly above MACDAverage.
On 60-minute chart, SlowK is Bearishly below SlowD while MACD is Bearishly below MACDAverage.
Disclaimer: This trading analysis is provided by a third party, and for informational purposes only. It does not reflect the views of Crypto Daily, nor is it intended to be used as legal, tax, investment, or financial advice.