Bitcoin (BTC/USD) worked to add to recent gains early in today’s Asian session as the pair notched gains to the 48351.92 level after recently trading as low as the 45469.32 level, with the interday high representing a test of the 78.6% retracement of the appreciating range from 47200 to 51995. The move higher also represented a test of the 76.4% retracement of the recent depreciating range from 49459.39 to 45469.32. Upside pressure again emerged around the 23.6% retracement of the broader depreciating range from 59118.84 to 42333. BTC/USD bulls are waiting to see if BTC/USD can sustain a break above the 51503.64 area, representing the 38.2% retracement of a broader depreciating range from 66339 to 42333.
BTC/USD recently peaked around the 49500 level after recovering from a descent to the 45727.92 area earlier this week. Selling pressure commenced around the 59114.84 level in recent weeks and many Stops were elected below downside price objectives during the selling pressure, including the 56533, 56080, 55735, 54295, 54114, 53748, 53600, 53046, 52351, 51322, 51171, 50185, 49361, 47400, 47426, 44974, and 44667 levels. Following the pair’s recent volatility, upside retracement levels and areas of potential technical resistance include the 52706.65, 55157.38, and 55526.67 areas. Traders are observing that the 50-bar MA (4-hourly) is bearishly indicating below the 100-bar MA (4-hourly) and below the 200-bar MA (4-hourly). Also, the 50-bar MA (hourly) is bearishly indicating below the 100-bar MA (hourly) and below the 200-bar MA (hourly).
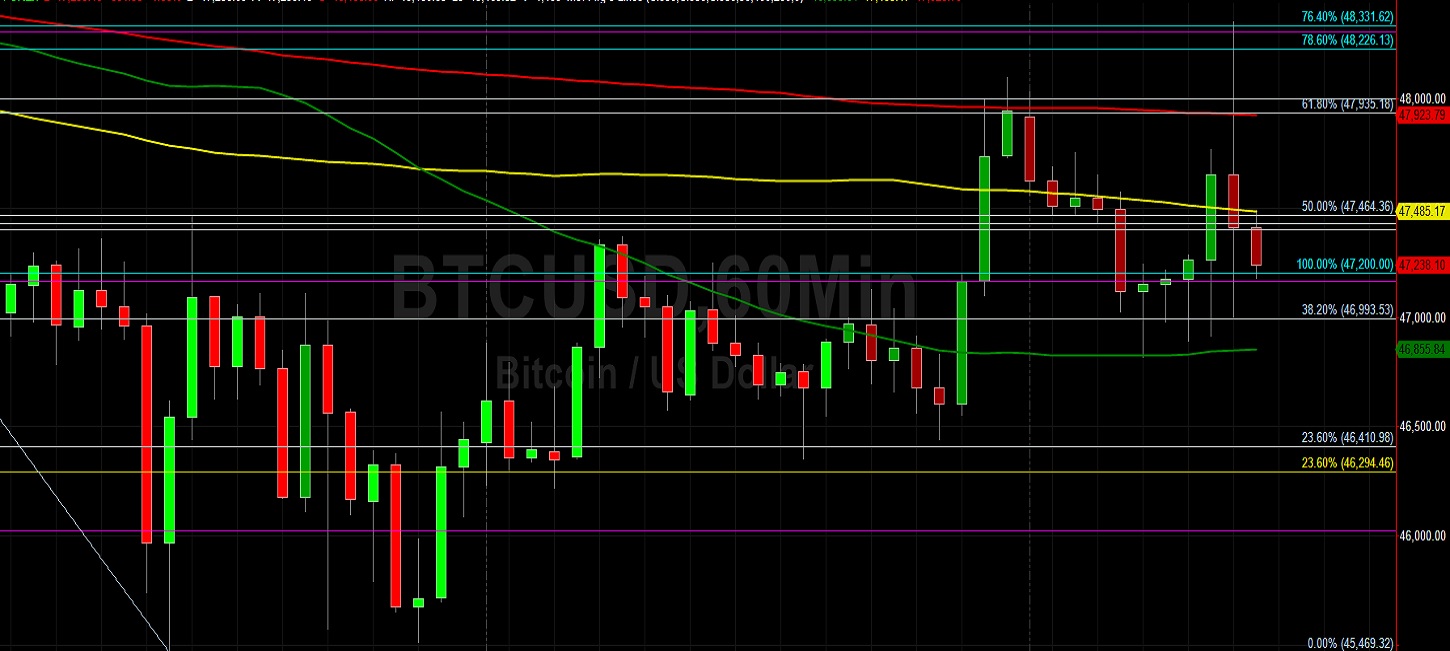
Price activity is nearest the 50-bar MA (4-hourly) at 47942.58 and the 100-bar MA (Hourly) at 47485.02.
Technical Support is expected around 42151.91/ 38670.39/ 35734.12 with Stops expected below.
Technical Resistance is expected around 52706.65/ 55157.38/ 55526.67 with Stops expected above.
On 4-Hourly chart, SlowK is Bearishly below SlowD while MACD is Bullishly above MACDAverage.
On 60-minute chart, SlowK is Bearishly below SlowD while MACD is Bearishly below MACDAverage.
Disclaimer: This trading analysis is provided by a third party, and for informational purposes only. It does not reflect the views of Crypto Daily, nor is it intended to be used as legal, tax, investment, or financial advice.