FED HOLDS INTEREST RATES AT ZERO DESPITE THE WORST INFLATION SINCE 1982
Bitcoin (BTC/USDT) is currently valued at $48763k, up 1.1% over the recent 24 hours and down 3.4% compared to a week ago. The largest crypto asset’s market capitalization is sitting at $921.7B, and the global cryptocurrency market cap today is $2.37T, up 2.7% when compared with 24 hours ago, according to coingecko.com.
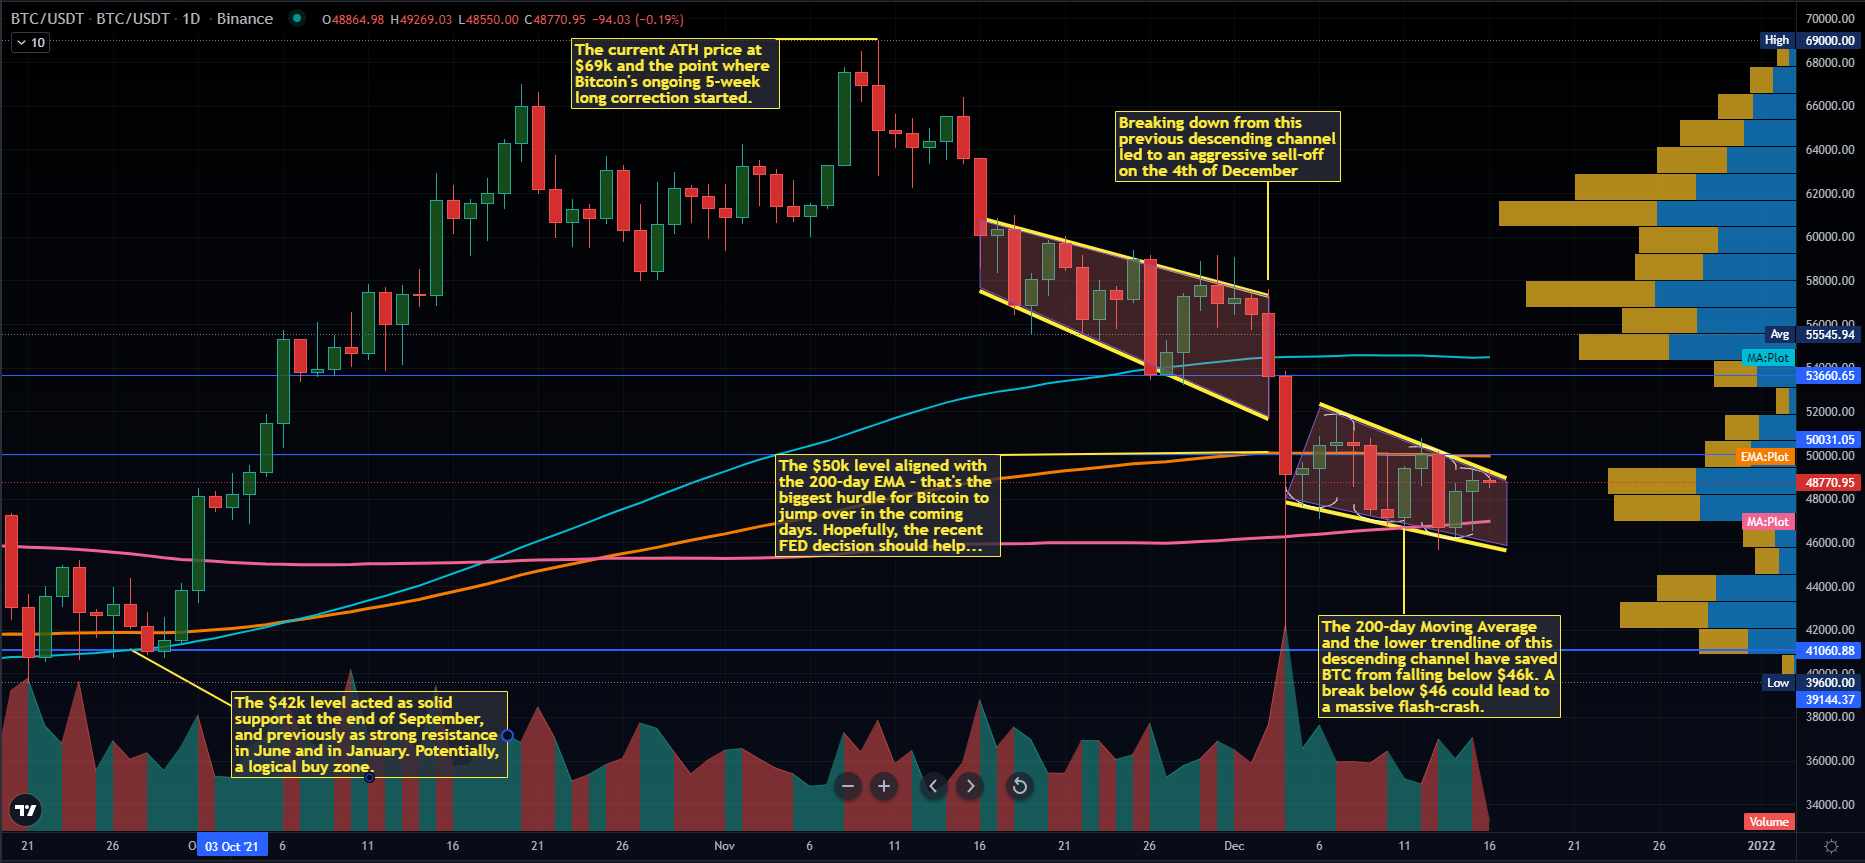
Yesterday, the oldest and the most popular crypto (by the way, BTC’s dominance is still fairly low at roughly 38.9%, in contrast to Ether’s dominance at 20.2%) finally received something of a much-needed positive catalyst for the price to once again attempt a breakout to the upside from a 12-day old descending channel at least, and in the best-case scenario, to even initiate a much-awaited reversal of the ongoing short-term Downtrend, which has spanned a period of 5 weeks now, since the current ATH was established at $69k on the 10th of November.
Namely, the U.S. policymakers voted to keep interest rates steady, that is, between 0.0% and 0.25%, where they have sat since March of last year. This rather widely expected announcement caused an immediate surge of palpable, albeit potentially short-lived, enthusiasm amongst crypto investors, which propelled Bitcoin to grow by roughly 4.3% within just one hour.
Without a shadow of a doubt, had The Federal Reserve decided to raise their interest rates, The King of Crypto would have surely been ‘pushed over the edge’, as in decisively a long distance below the 200-day Moving Average, which had been acting as Bitcoin’s last-ditch support over the previous week. A large portion of cryptocurrency traders (and their trading bots, let us not forget) utilise this particular long-term Moving Average to identify a Bear Market or a Bull Market, so we can definitely consider the FED’s decision very much a pivotal one for crypto as well.
The cryptocurrency market as a whole has generally been strongly correlated with the traditional US Stock Market’s trajectory in terms of prices, especially over the recent weeks. Therefore, it is worth noting here, that shortly after the aforementioned FED vote, the S&P 500 (a stock market index tracking the performance of 500 large companies listed on stock exchanges in the United States) instantly recovered its recent losses and even went on to establish the new all-time high value at $4709.
MEANWHILE, IN THE BTC CHART...
As far as Bitcoin goes, the incoming wave of renewed buying pressure has not yet been strong enough to push the original digital asset’s price action above the upper trendline of a descending channel formed 12 days ago as a result of a massive sell-off, not to mention to force a way through a resilient level of resistance (and also psychologically crucial due to being a round number) at $50k. Additionally, the task of breaking above this price is even more complicated due to the 200-day Exponential Moving Average sitting almost precisely on the $50k mark.
Hopefully, if the aforementioned S&P 500 index keeps growing for the rest of the week, then the cryptocurrency market will follow suit, and we might see some retail confidence finally start coming back. Presently though, the Fear & Greed index (according to alternative.me, which, by the way, is far from being a perfect indicator, but we will go into more details on another occasion) is sitting at 29/100 indicating Fear. It’s already been twelve days of Fear in the markets in a row – the longest period below 30/100 since late July, when the correction that started in May was coming to its end.
At the moment, that is in the early hours of the morning of Thursday, Bitcoin is being once again rejected by the upper trendline of the newly-formed descending channel. The nearest support is obviously the 200-day Moving Average at around $47k, which has been tested over the four out of five recent days. Any chartist worth their salt knows that the more times a level of support is tested, the weaker it becomes. So, hopefully we won’t see any more touches on the 200-day MA anytime soon.
In case we do though, Bitcoin could still bounce off of the lower trendline of the said descending channel. In any event, we don’t want to close the next weekly candle beneath the above-mentioned Moving Average. That would most likely flip a large portion of investors bearish, which could cause a snowball effect and a possible drastic sell-off. Such a situation might still end up okay, as long as the potential decline stops at $41k and the price reverses to the upwards. That would form a double bottom in the chart, which is considered a strong reversal pattern in the Technical Analysis.
Placing some buy limits around the $41k mark doesn’t seem like a useless strategy to us, as Bitcoin could conceivably revisit this area again during a potential flash-crash. It’s worth remembering that $41k already acted as reliable support back in September, but also as strong resistance both in June and January this year. If that doesn’t hold though, then making a case for a Bull Market will be practically impossible, or even deluded, to be perfectly honest.
Having said that, hopefully Bitcoin will start its rally to the upwards soon in order to end 2021 in a spectacular fashion. Another extensive Bitcoin write-up will appear on cryptodaily.co.uk this weekend, Stay Safe In The Markets!
Disclaimer: This article is provided for informational purposes only. It is not offered or intended to be used as legal, tax, investment, financial, or other advice