ETH/USD Looking for New Sentiment: Sally Ho's Technical Analysis 12 June 2021 ETH
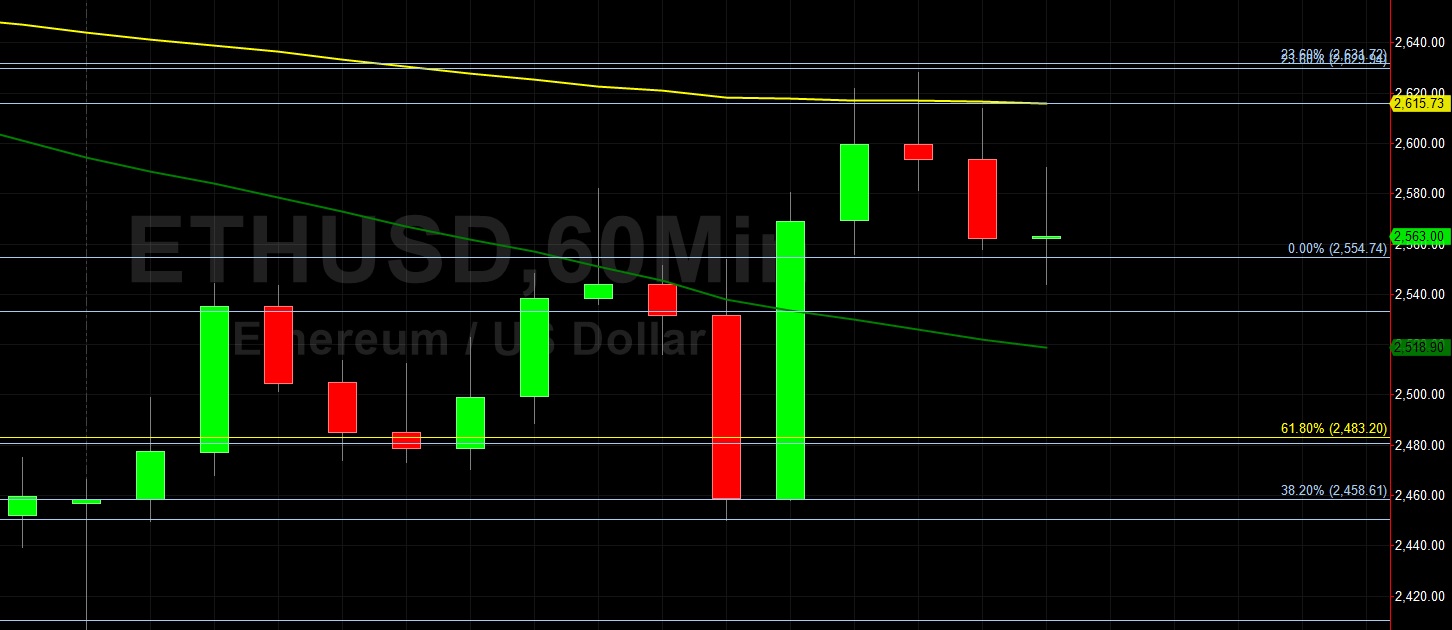
Ethereum (ETH/USD) remained pressured early in today’s Asian session as the pair continued to trade below the psychologically-important 3000 figure following its May depreciation from lifetime highs around the 4384.43 level. Stops were recently elected below the 2615.91 area representing the 61.8% retracement of the depreciating range from 2884 to 2182.20. Additional Stops were also recently elected below additional downside retracement levels in the same range, including the 2533.10, 2450.29, and 2347.82 levels. Selling pressure intensified from the 3567.40 area recently and Stops were elected below several downside price objectives and areas of potential technical support, including the 3485.38, 3212.13, 2938.87, 2725.38, 2600.77, 2549.82, 2451.84, 2334.65, 2178.29, 2054.25, 1987.71, 1944, 1912.06, and 1874.99 levels.
Potential technical support levels during pullbacks include the 1783.89, 1755.41, 1730.47, 1456.03, 1371.71, 1317.79, 1229.48, and 1103.49 levels. During the recent appreciation to an all-time high around the 4384.43 area, Stops were elected above the 3987.65, 4113.81, and 4136.61 areas, upside price objectives related to historic buying pressure that originated around the 90 figure. Additional upside project objectives include the 4453.47, 4471.68, 4522.73, 4550.12, and 4609.38 levels. Traders are observing that the 50-bar MA (4-hourly) is bearishly indicating below the 200-bar MA (4-hourly) and above the 100-bar MA (4-hourly). Also, the 50-bar MA (hourly) is bearishly indicating below the 100-bar MA (hourly) and below the 200-bar MA (hourly).
Price activity is nearest the 100-bar MA (4-hourly) at 2616.53 and the 50-bar MA (Hourly) at 2531.70.
Technical Support is expected around 1860/ 1783.89/ 1755.41 with Stops expected below.
Technical Resistance is expected around 3122.22/ 3420.10/ 3788.66 with Stops expected above.
On 4-Hourly chart, SlowK is Bullishly above SlowD while MACD is Bearishly below MACDAverage.
On 60-minute chart, SlowK is Bearishly below SlowD while MACD is Bullishly above MACDAverage.
Disclaimer: This trading analysis is provided by a third party, and for informational purposes only. It does not reflect the views of Crypto Daily, nor is it intended to be used as legal, tax, investment, or financial advice.

Related Stories