ETH/USD Encounters Resistance at 2279: Sally Ho's Technical Analysis 20 June 2021 ETH
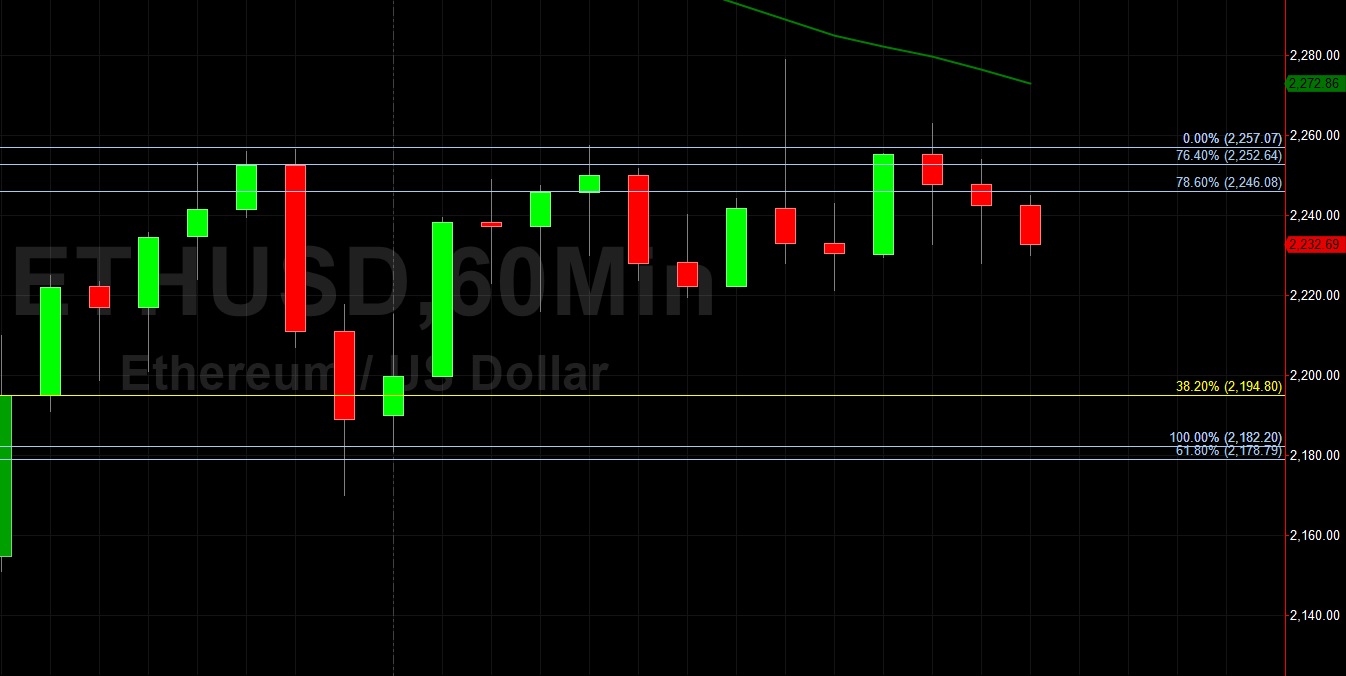
Ethereum (ETH/USD) extended recent weakness early in today’s Asian session as the pair depreciated to the 2227.97 level after trading as high as the 2279 area during the European session, with the interday high representing a test of the 50-hour simple moving average. Traders observe ETH/USD traded as low as the 2170 area during yesterday’s Asian session, just above the recent low of 2125.12. One range that many traders are monitoring is the depreciating range from 2950 to 1728, with the 2194.80 and 2339 levels representing the 38.2% and 50% retracement levels. Stops were recently elected above the 2553.11 and 2565.21 levels during the move higher, representing the 50% retracements of the depreciating ranges from 2873.35 to 2257.07, and 2849.15 to 2257.07. Potential technical support levels during pullbacks include the 2178, 2005, 1979, 1783, and 1725 levels.
During the recent appreciation to an all-time high around the 4384.43 area, Stops were elected above the 3987.65, 4113.81, and 4136.61 areas, upside price objectives related to historic buying pressure that originated around the 90 figure. Areas of potential technical resistance include 2742, 3056, and 3369. Traders are observing that the 50-bar MA (4-hourly) is bearishly indicating below the 100-bar MA (4-hourly) and below the 200-bar MA (4-hourly). Also, the 50-bar MA (hourly) is bearishly indicating below the 100-bar MA (hourly) and below the 200-bar MA (hourly).
Price activity is nearest the 50-bar MA (4-hourly) at 2403.30 and the 50-bar MA (Hourly) at 2272.81.
Technical Support is expected around 1860/ 1783.89/ 1755.41 with Stops expected below.
Technical Resistance is expected around 3122.22/ 3420.10/ 3788.66 with Stops expected above.
On 4-Hourly chart, SlowK is Bullishly above SlowD while MACD is Bearishly below MACDAverage.
On 60-minute chart, SlowK is Bearishly below SlowD while MACD is Bullishly above MACDAverage.
Disclaimer: This trading analysis is provided by a third party, and for informational purposes only. It does not reflect the views of Crypto Daily, nor is it intended to be used as legal, tax, investment, or financial advice.

Related Stories