BTC/USD Peaks Around 36457: Sally Ho's Technical Analysis 20 June 2021 BTC
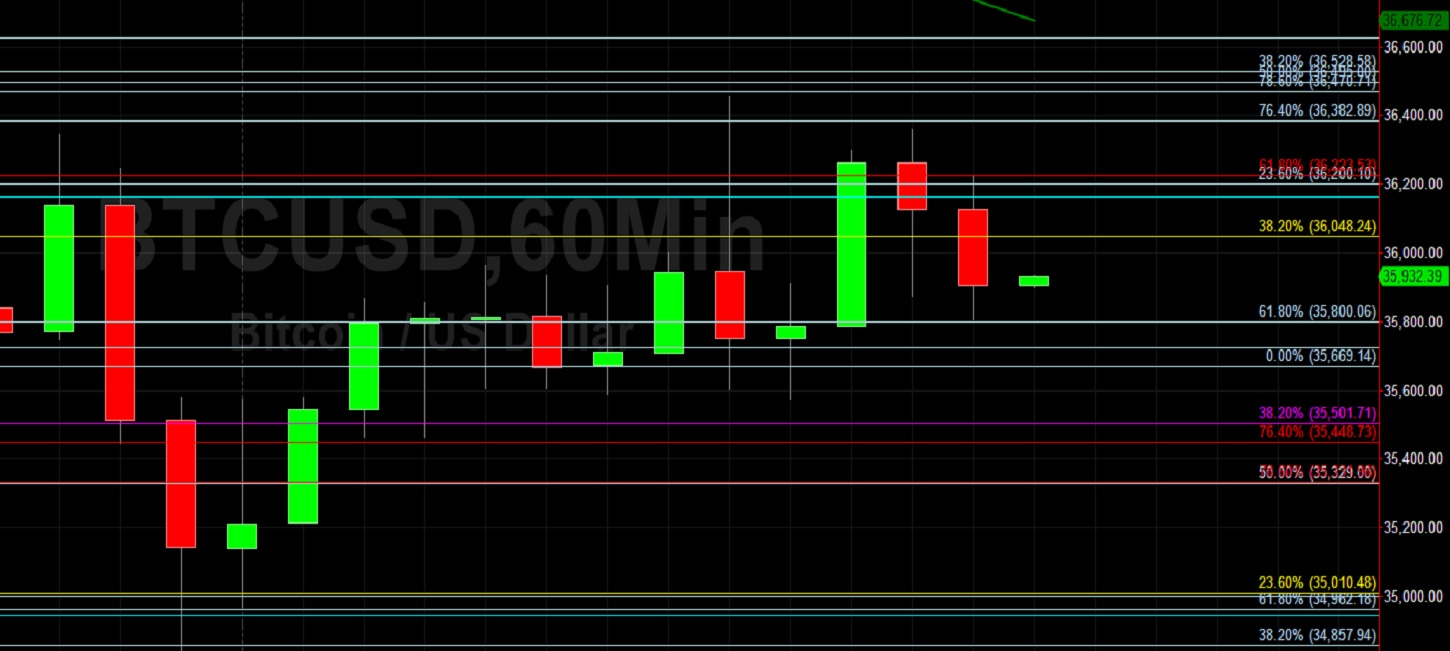
Bitcoin (BTC/USD) drifted higher early in today’s Asian session as the pair appreciated to the 35875.59 level after trading as low as the 35214.76 level during the European session, with a recent low of 34833.26 representing a test of the 38.2% retracement of the depreciating range from 37325 to 33333. Traders pushed BTC/USD as high as the 36457.18 area during the European session before selling pressure emerged, a level that represents a test of the 50% retracement of the appreciating range from 30000 to 42990. Stops were recently elected above the psychologically-important 40000 and 41000 figures during the ascent to multi-week highs. Traders are observing the 41304.22 level as potential technical resistance, representing the 38.2% retracement of the recent depreciating range from 59592.20 to 30000.
Many technical support levels related to broader historic ranges also gave way during the recent acute move lower including the 51375, 51245, 50527, 48478, 47698, 47136, 41581, 40303, and 39604 areas. Upside retracement levels and areas of potential technical resistance include the 41304, 43331, 44796, 47449, 48287, and 51567 levels. Potential areas of technical support include the 29156, 28747, 28387, 27706, 27317, 27175, 26621, and 26249 levels. Traders are observing that the 50-bar MA (4-hourly) is bullishly indicating above the 100-bar MA (4-hourly) and above the 200-bar MA (4-hourly). Also, the 50-bar MA (hourly) is bearishly indicating below the 100-bar MA (hourly) and below the 200-bar MA (hourly).
Price activity is nearest the 100-bar MA (4-hourly) at 36970.18 and the 50-bar MA (Hourly) at 36738.70.
Technical Support is expected around 29156/ 28747.28/ 27706.27 with Stops expected below.
Technical Resistance is expected around 46000/ 51569.56/ 64899 with Stops expected above.
On 4-Hourly chart, SlowK is Bullishly above SlowD while MACD is Bearishly below MACDAverage.
On 60-minute chart, SlowK is Bearishly below SlowD while MACD is Bullishly above MACDAverage.
Disclaimer: This trading analysis is provided by a third party, and for informational purposes only. It does not reflect the views of Crypto Daily, nor is it intended to be used as legal, tax, investment, or financial advice.

Related Stories