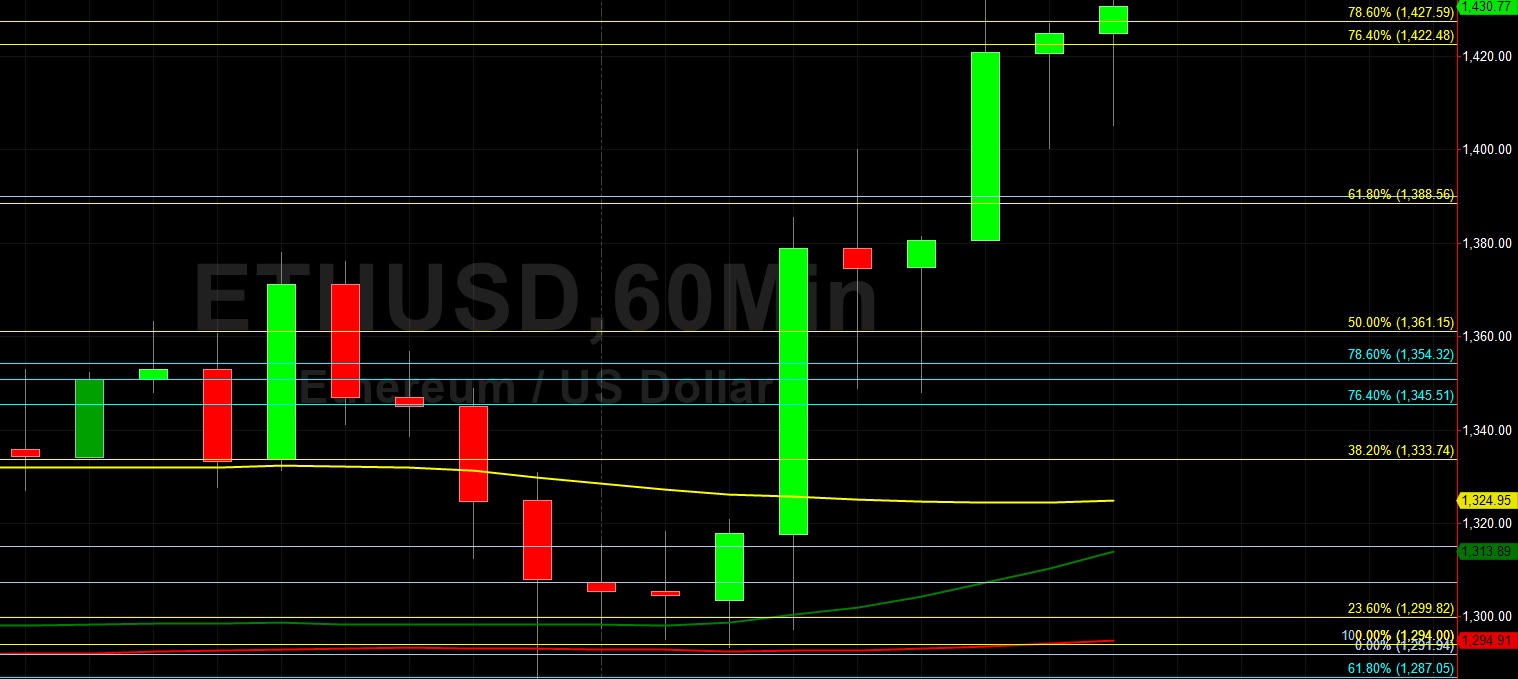
Ethereum (ETH/USD) made huge gains early in today’s North American session as the pair appreciated to the 1432.00 area after trading as low as the 1286.56 area during the Asian session, with the intraday low representing a test of the 61.8% retracement of the depreciating range from 1440 to 1039.62. Stops were elected above the 1388.56 area en route to a test of the 1427.59 area, representing the 78.6% retracement of the depreciating range from 1477.30 to 1245. Traders are waiting to see if ETH/USD bulls have the strength to establish a new multi-year high above the 1477.30 area. If ETH/USD is able to extend its recent comeback further, some areas of potential technical resistance include the 1477.71, 1582.86, and 1665.31 areas. During ETH/USD’s recent move higher to multi-year highs, Stops were recently elected above the 1072.78, 1133.44, 1163.93, 1176.28, 1225.30, and 1230.73 areas, and selling pressure intensified below these areas during the pullback. Notably, these levels represented technically significant upside price objectives related to historical buying pressure around the 215.16, 625.01, 370.50, 480.08, 530.32, and 310.79 areas.
Some Stops were recently elected above the 1256.15, 1307.31, and 1315.02 areas, upside retracement levels related to the recent depreciating range from 1390 to 1039.62. If ETH/USD reverses recent gains and the psychologically-important 1000 figure cannot be held, technical traders will eye additional downside retracement areas including the 976.37, 954.16, 941.22, 917.03, 915.48, 902.24, 895.33, 869.22, 860.69, 856.83, 844.44, 831.94, 828.97, 812.73, 783.02, 770.03, 763.66, 750.28, 745.01, and 723.97 areas. Traders are observing that the 50-bar MA (4-hourly) is bullishly indicating above the 100-bar MA (4-hourly) and above the 200-bar MA (4-hourly). Also, the 50-bar MA (hourly) is bearishly indicating below the 100-bar MA (hourly) and above the 200-bar MA (hourly).
Price activity is nearest the 50-bar MA (4-hourly) at 1299.93 and the 100-bar MA (Hourly) at 1324.94.
Technical Support is expected around 792.40/ 766.54/ 729.88 with Stops expected below.
Technical Resistance is expected around 1477.30/ 1582.86/ 1606.62 with Stops expected above.
On 4-Hourly chart, SlowK is Bullishly above SlowD while MACD is Bullishly above MACDAverage.
On 60-minute chart, SlowK is Bullishly above SlowD while MACD is Bullishly above MACDAverage.
Disclaimer: This trading analysis is provided by a third party, and for informational purposes only. It does not reflect the views of Crypto Daily, nor is it intended to be used as legal, tax, investment, or financial advice.