Bitcoin (BTC/USD) continued to trade in a volatile manner early in today’s North American session as the pair continued to exhibit weakness below the psychologically-important 40000 figure following recent headwinds encountered around the 41452.12 area. The 40164.67 level emerged as one where additional selling pressure intensified over the weekend and traders initially pushed the pair as low as the 34444.00 area, its weakest print after recently establishing a new lifetime high around the 41986.37 area and a test of the 38.2% retracement of the appreciating range from 21913.84 to 41986.37. Stops were elected below a variety of downside retracement levels during the acute pullback, including the 38159.91, 37249.25, 36226.47, 35900.79, 35784.73, and 35454.75 areas. Following the recent pullback, additional areas of potential technical support include the 32988.07, 32663.14, 32135.98, 31948.12, 31414.00, 29783.19, 29093.19, 28847.31, 28148.19, and 27421.33 levels.
During the recent move higher, Stops were recently elected above a series of additional upside price objectives including the 40517.80, 40667.76, 40991.44, 41200, 41267.10, and 41489.74 levels. Stops were recently elected above the 35943.73, 36480.83, and 36854.45 areas as well, upside price objectives related to previous buying pressure around the 17580, 16200, and 9819.83 levels and the sell-off intensified below these areas during the recent depreciation. If BTC/USD is able to extend recent gains to the upside, additional upside price objectives include the 42309.01, 42701.91, 42803.53, 43447.48, and 43617.07 levels. Traders are observing that the 50-bar MA (4-hourly) is bullishly indicating above the 100-bar MA (4-hourly) and above the 200-bar MA (4-hourly). Also, the 50-bar MA (hourly) is bullishly indicating above the 100-bar MA (hourly) and above the 200-bar MA (hourly).
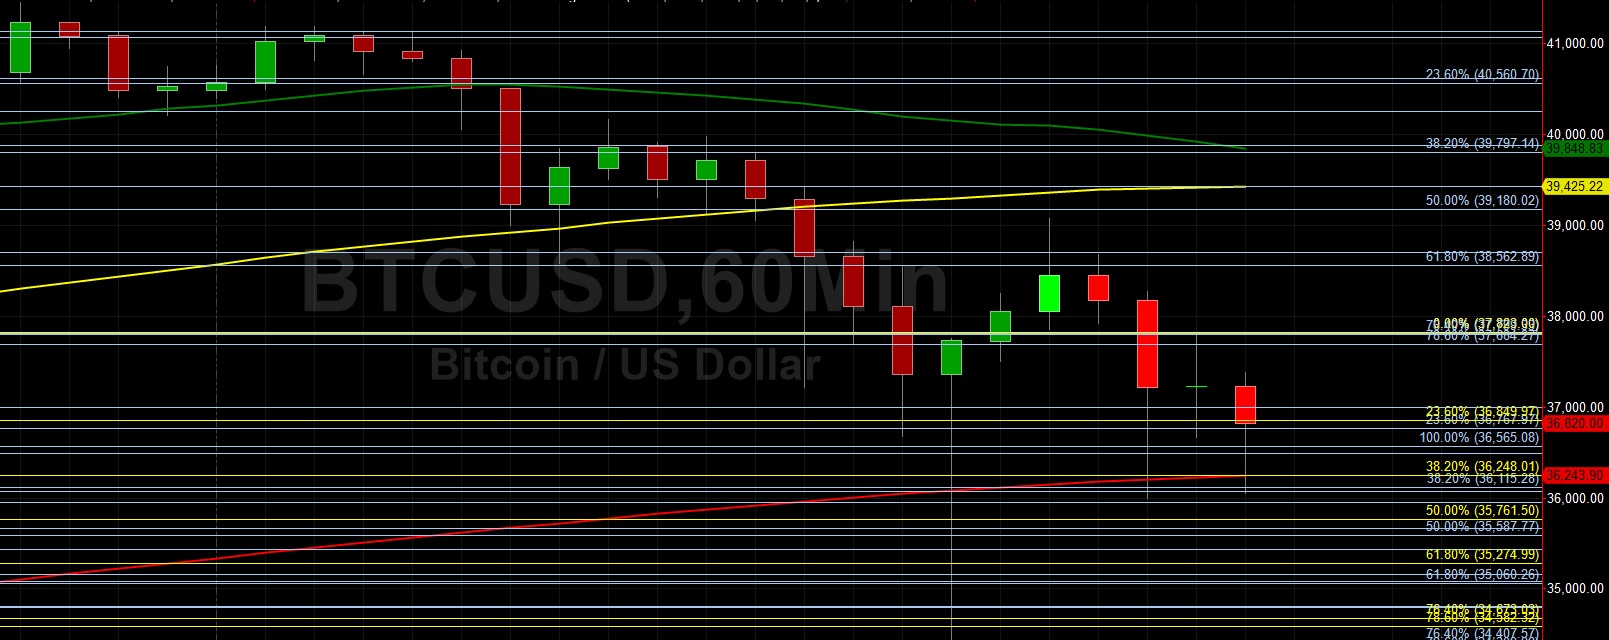
Price activity is nearest the 50-bar MA (4-hourly) at 36352.72 and the 200-bar MA (Hourly) at 36244.39.
Technical Support is expected around 33638.11/ 33121.14/ 32164.09 with Stops expected below.
Technical Resistance is expected around 42309.01/ 42701.91/ 42803.53 with Stops expected above.
On 4-Hourly chart, SlowK is Bearishly below SlowD while MACD is Bearishly below MACDAverage.
On 60-minute chart, SlowK is Bearishly below SlowD while MACD is Bearishly below MACDAverage.
Disclaimer: This trading analysis is provided by a third party, and for informational purposes only. It does not reflect the views of Crypto Daily, nor is it intended to be used as legal, tax, investment, or financial advice.