The Bitcoin price set a new record after a deep correction, demonstrating again that institutional and individual investors use any chance to buy the cryptocurrency at a decline. The Bitcoin enjoys a mighty uptrend. While the leading altcoin rests at the top of the market, gold keeps falling. Traders are sure that market players leave gold and invest in the BTC and other altcoins. Many major players speak aloud about selling gold and buying the BTC and ETH instead in a proportion of 80 to 20. The renewal of the all-time high is also heating the interest of investors who are ready to buy “digital gold” at any price, trying to enter the market before a new wave of growth.
However, not all the traders are confident about further growth of the BTC. John Bollinger, the author of a famous indicator, warns his readers that the current movement of the Bitcoin looks like a classical Top pattern. However, until this pattern is supported by a breakaway of the support level at 16,200 USD, it is too early to talk about a reversal. Moreover, such a price pattern can easily be broken by buyers if the upward movements continue. Thus, we need to be super careful at the current record levels. We might be witnessing a Double Top pattern when the price tests the resistance level twice but fails to break it away and falls below the lower border of the pattern. If this is true, we can count on a decline in the price for the height of the pattern. If on the BTC chart bulls fail to break through 20,000 USD, and the price falls to 16,200 USD, it is likely to go deeper down to 13,700 USD.
If the digital euro appear in 5 years only (as analysts say), Sberbank of Russia is ready to issue its digital currency in the nearest future. The bank is planning to start testing its “Sbercoin” in 2021. Also, in January 2021, Facebook is going to issue the Libra. This asset will be supported by the USD, which will rid it of excessive volatility, characteristic of the Bitcoin, where price movements can reach thousands of dollars. Hence, stablecoins, Libra included, are more suitable for payments and money transfers.
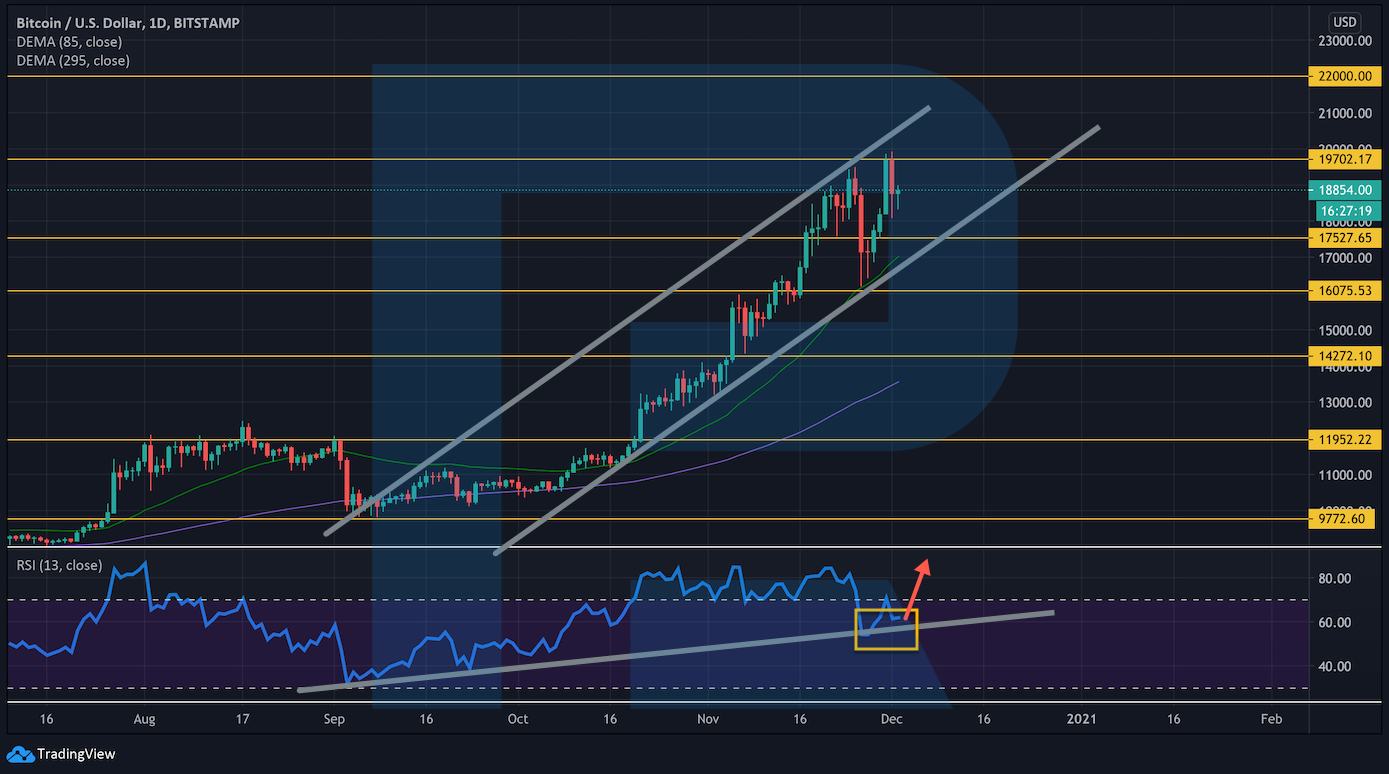
As for tech analysis, the BTC is inside a strong uptrend – during the correction, the price did not even reach the fast Moving Average. Meanwhile, the RSI is pushing off the support line, giving another signal for growth. However, buyers must secure above 19,705 USD to break the reversal pattern mentioned by John Bollinger. Otherwise, if the lower border of the bullish channel is broken and the price secures under 17,525 USD, the asset might start a lengthy correction.
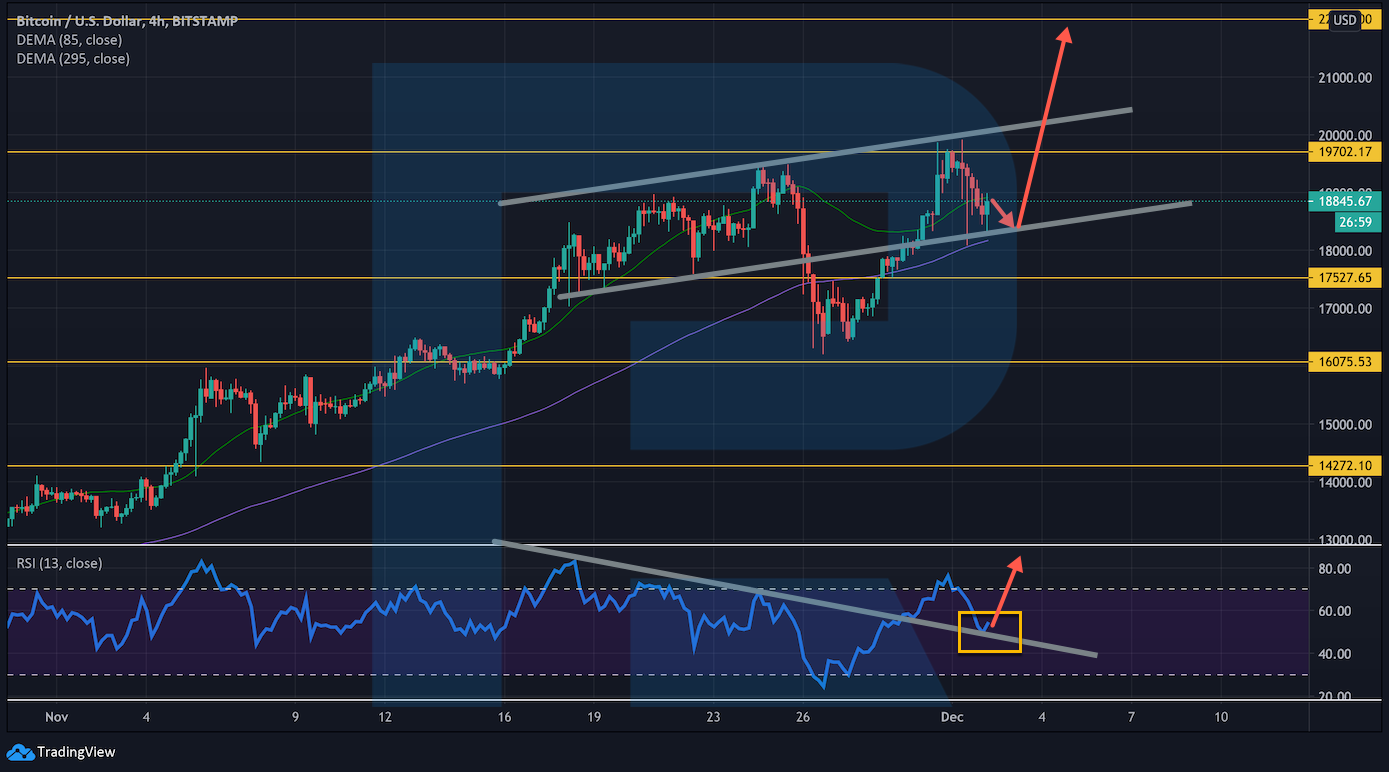
On H4, an upside-down Head and Shoulders pattern is forming. The pattern is not very typical due to a peculiar inclination of the Neck, and in such a case, it is not always broken away – most often, the price bounces off the level of the right Shoulder. Hence, in the nearest future, the BTC might start growing aggressively, renewing all-time highs. If the price secures above the Neck, we may expect the asset to keep growing to 21,500 USD and higher. Such a scenario will be additionally confirmed by a bounce off the support line on the RSI, which might cause the closing price to break through the nearest resistance level.





The Bitcoin price set a new record after a deep correction, demonstrating again that institutional and individual investors use any chance to buy the cryptocurrency at a decline. The Bitcoin enjoys a mighty uptrend. While the leading altcoin rests at the top of the market, gold keeps falling. Traders are sure that market players leave gold and invest in the BTC and other altcoins. Many major players speak aloud about selling gold and buying the BTC and ETH instead in a proportion of 80 to 20. The renewal of the all-time high is also heating the interest of investors who are ready to buy “digital gold” at any price, trying to enter the market before a new wave of growth.
However, not all the traders are confident about further growth of the BTC. John Bollinger, the author of a famous indicator, warns his readers that the current movement of the Bitcoin looks like a classical Top pattern. However, until this pattern is supported by a breakaway of the support level at 16,200 USD, it is too early to talk about a reversal. Moreover, such a price pattern can easily be broken by buyers if the upward movements continue. Thus, we need to be super careful at the current record levels. We might be witnessing a Double Top pattern when the price tests the resistance level twice but fails to break it away and falls below the lower border of the pattern. If this is true, we can count on a decline in the price for the height of the pattern. If on the BTC chart bulls fail to break through 20,000 USD, and the price falls to 16,200 USD, it is likely to go deeper down to 13,700 USD.
If the digital euro appear in 5 years only (as analysts say), Sberbank of Russia is ready to issue its digital currency in the nearest future. The bank is planning to start testing its “Sbercoin” in 2021. Also, in January 2021, Facebook is going to issue the Libra. This asset will be supported by the USD, which will rid it of excessive volatility, characteristic of the Bitcoin, where price movements can reach thousands of dollars. Hence, stablecoins, Libra included, are more suitable for payments and money transfers.
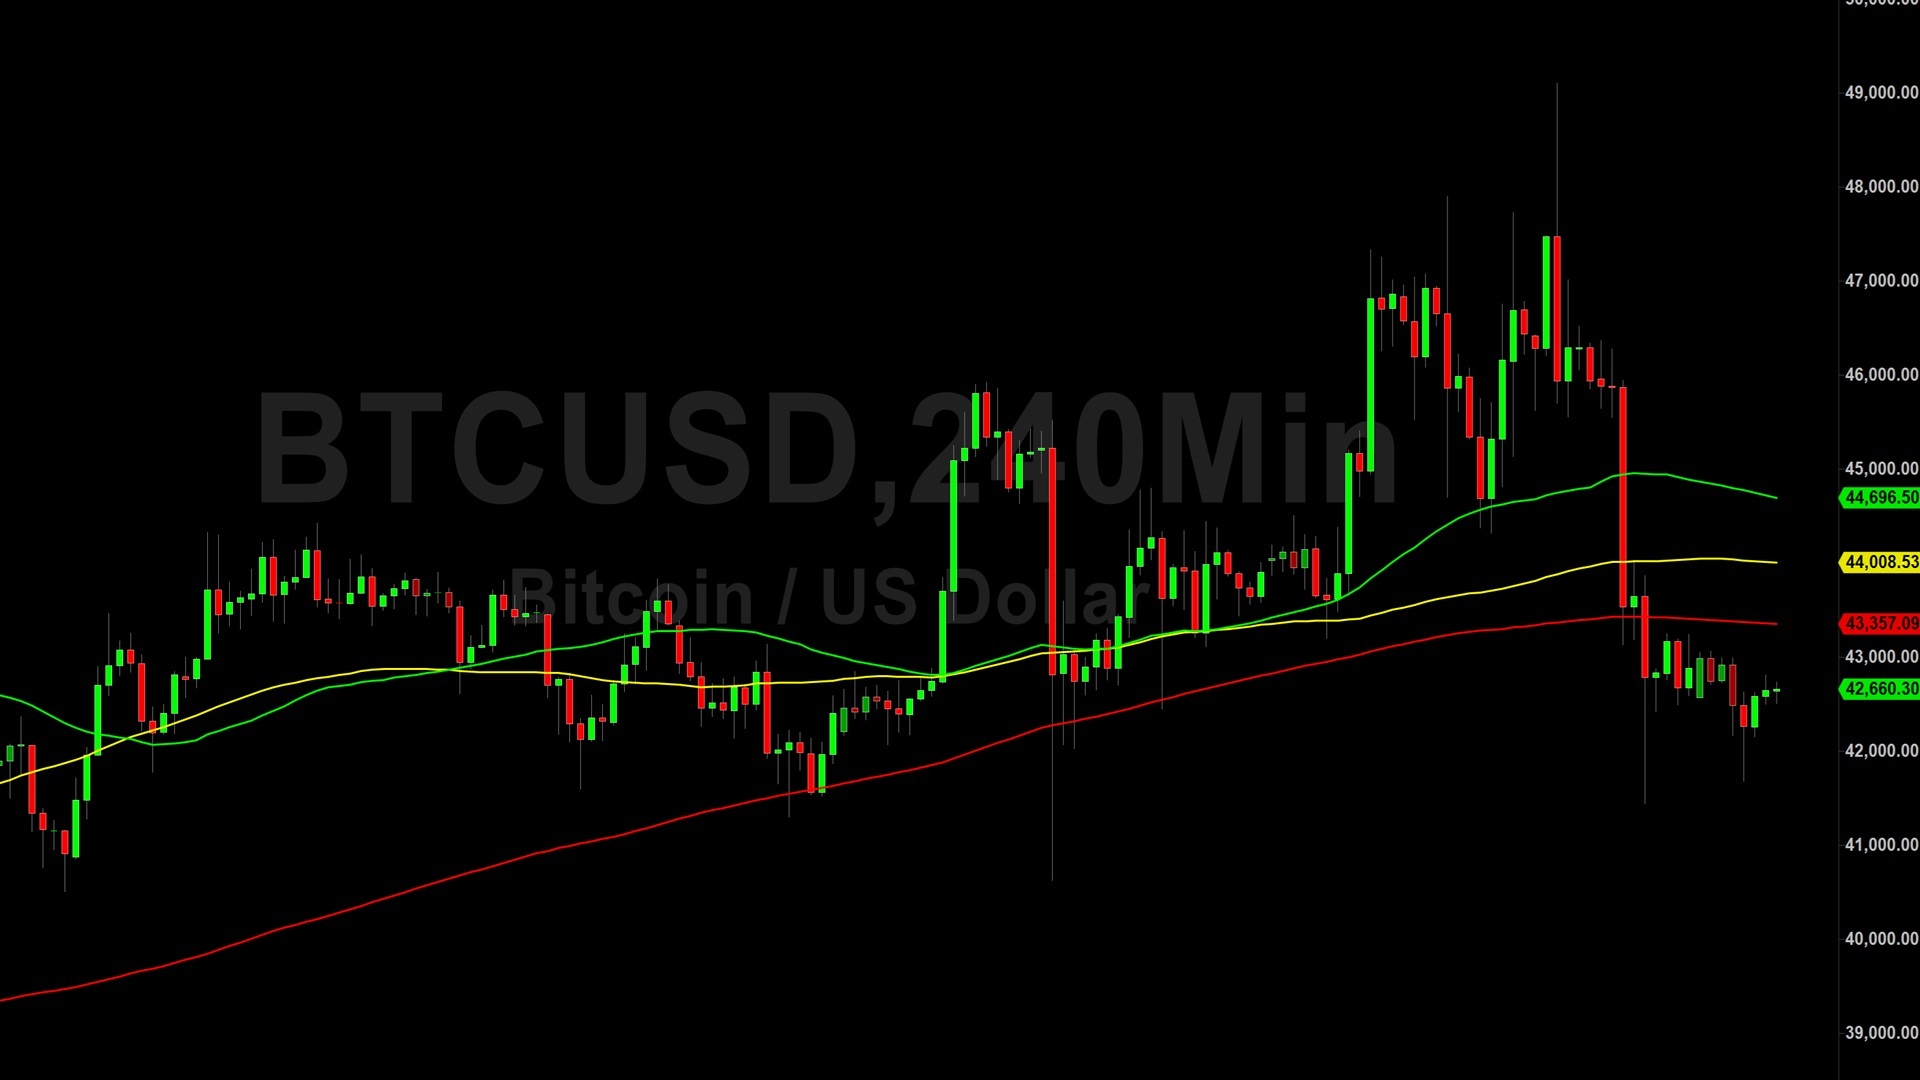
As for tech analysis, the BTC is inside a strong uptrend – during the correction, the price did not even reach the fast Moving Average. Meanwhile, the RSI is pushing off the support line, giving another signal for growth. However, buyers must secure above 19,705 USD to break the reversal pattern mentioned by John Bollinger. Otherwise, if the lower border of the bullish channel is broken and the price secures under 17,525 USD, the asset might start a lengthy correction.
On H4, an upside-down Head and Shoulders pattern is forming. The pattern is not very typical due to a peculiar inclination of the Neck, and in such a case, it is not always broken away – most often, the price bounces off the level of the right Shoulder. Hence, in the nearest future, the BTC might start growing aggressively, renewing all-time highs. If the price secures above the Neck, we may expect the asset to keep growing to 21,500 USD and higher. Such a scenario will be additionally confirmed by a bounce off the support line on the RSI, which might cause the closing price to break through the nearest resistance level.