ETH/USD To End Year With About 450% Gain: Sally Ho's Technical Analysis 31 December 2020 ETH
Ethereum (ETH/USD) came off early in today’s North American session as the pair moved lower to the 724.00 area after trading as high as the 759.00 area during the Asian session, a fresh multi-year high that was established after Stops were elected above the 750.28 area, an upside price objective. Traders observe that upside buying pressure emerged around the 724.46 area today, right around the 61.8% retracement of the depreciating range from 747 to 688. The next downside retracement levels in this depreciating range include 717.50, 710.54, and 701.92. Additional upside price objectives include the 770.03, 787.22, and 828.97 areas. Additional technical support has also recently emerged around the 717.00 area, right around the 50% retracement of the recent depreciating range from 747.00 to 688.00. Chartists are observing that ETH/USD continues to orbit the 50-hour simple moving average.
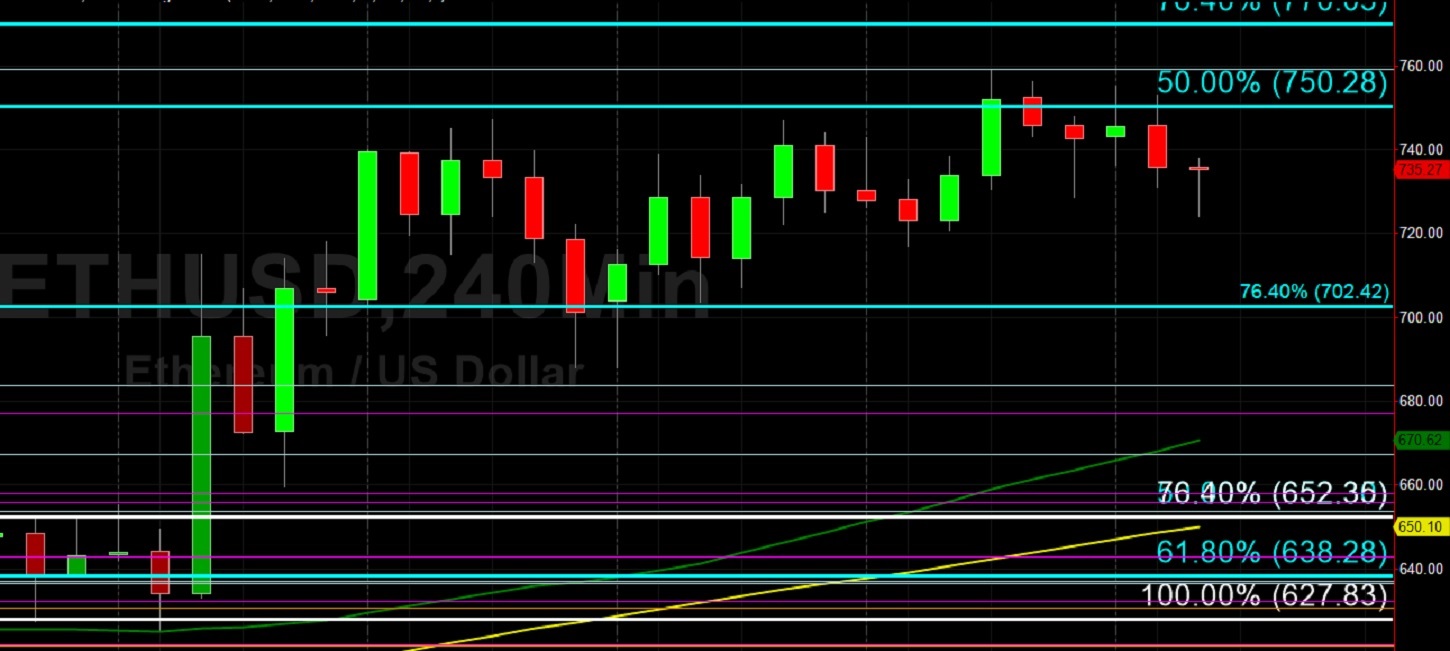
Significant Stops were recently elected above the 615.19, 637.79, 668.87, 679.78, and 698.88 area during the march to successive multi-year highs. Additional upside price objectives include the 819.23, 879.23, 910.42, 939.22, and 985.15 areas. Following the pair’s recent moves to successive all-time highs, downside retracement levels and areas of potential technical support include the 702.42, 683.66, 667.31, 653.74, 628.40, and 601.94 levels. ETH/USD has recently traded up more than 21% month-to-date, and is poised to close the year with a 450% gain. Traders are observing that the 50-bar MA (4-hourly) is bullishly indicating above the 100-bar MA (4-hourly) and above the 200-bar MA (4-hourly). Also, the 50-bar MA (hourly) is bullishly indicating above the 100-bar MA (hourly) and above the 200-bar MA (hourly).
Price activity is nearest the 50-bar MA (4-hourly) at 670.63 and the 50-bar MA (Hourly) at 735.64.
Technical Support is expected around 699.32/ 612.33/ 530.32 with Stops expected below.
Technical Resistance is expected around 759.00/ 819.23/ 877.71 with Stops expected above.
On 4-Hourly chart, SlowK is Bearishly below SlowD while MACD is Bearishly below MACDAverage.
On 60-minute chart, SlowK is Bearishly below SlowD while MACD is Bearishly below MACDAverage.

Related Stories