Bitcoin (BTC/USD) weakened early in today’s North American session as the pair depreciated to the 23050.09 level after trading as high as the 23472.11 area earlier in the European session. Traders took the pair as low as the 23600 level during the Asian session, but BTC/USD twice encountered buying pressure around the 200-hour simple moving average. Traders are curious to see how BTC/USD trades through the holiday period and finishes the calendar year. BTC/USD has recently traded up more than 18% month-to-date, and traded up more than 221% year-to-date. The pair’s recently-established lifetime high around the 24300 area has traders focusing on some key retracement levels including the 22195.94, 21865.96, 21607.54, 21144.00, 20957.11, 20882.68, 18889.05, 18768.58, 17217.61, 17059.92, and 15546.17 levels.
If BTC/USD resumes recent upward buying pressure, additional upside price objectives include the 24374.73, 24758.05, 24862.28, 25171.61, and 25373.10 areas. Other levels that are technically significant include a range of upside price objectives above which Stops were elected during the recent appreciation, and these include the 23650.19, 23693.29, 23779.58, 24080.75, and 24179.17 levels. Traders are observing that the 50-bar MA (4-hourly) is bullishly indicating above the 100-bar MA (4-hourly) and above the 200-bar MA (4-hourly). Also, the 50-bar MA (hourly) is bullishly indicating above the 100-bar MA (hourly) and above the 200-bar MA (hourly).
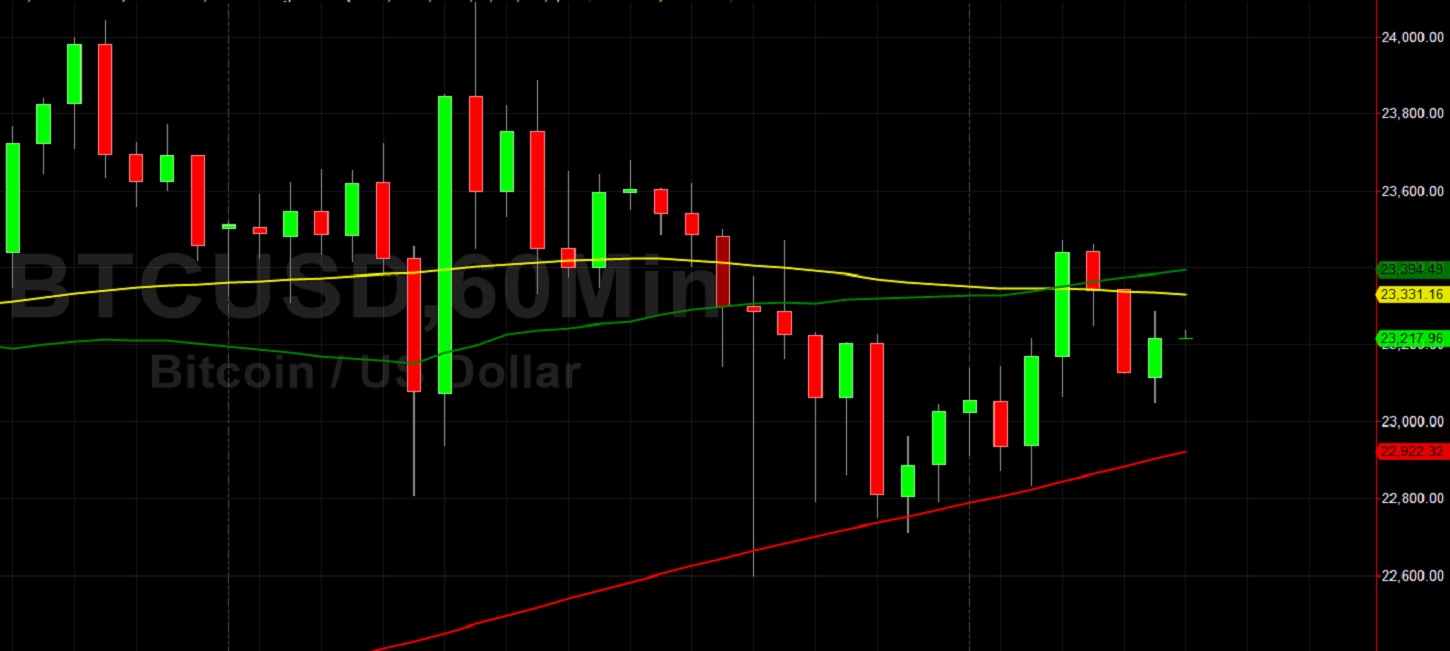
Price activity is nearest the 50-bar MA (4-hourly) at 22965.53 and the 100-bar MA (Hourly) at 23336.10.
Technical Support is expected around 21971.13/ 21409.71/ 20678.47 with Stops expected below.
Technical Resistance is expected around 24374.73/ 24758.05/ 25171.61 with Stops expected above.
On 4-Hourly chart, SlowK is Bullishly above SlowD while MACD is Bearishly below MACDAverage.
On 60-minute chart, SlowK is Bearishly below SlowD while MACD is Bullishly above MACDAverage.