Ethereum (ETH/USD) gave back some gains early in today’s North American session as the pair depreciated to the 378.53 area after trading as high as the 382.30 area in the European session. Traders sold ETH/USD from the 387.89 area during the Asian session, just above the 38.2% retracement of the recent appreciating range from 332.87 to 421.47. Traders are paying attention to the recent appreciating range from 332.87 to 421.47, and are observing that the next downside retracement levels in the appreciating range include 366.72, 353.78, and 351.83. During the recent pullback lower, Stops were elected below the 404.79, 400.48, 396.99, 393.50, 389.19, and 388.54 areas, retracement areas related to the recent appreciating range from 382.21 to 411.77. Traders are also observing that the 100-bar 4-hourly simple moving average has bearishly moved above the 50-bar 4-hourly simple moving average.
Additional upside price objectives include 420.89, 425.31, 427.78, 437.41, and 446.90. Following ETH/USD’s run-up, traders are paying close attention to the 403.11, 395.14, 388.69, 382.84, and 374.27 levels as areas of potential technical support. Additional areas of potential upside pressure include the 393.37, 379.37, and 368.05 levels. The 396.69 area remains an important technical level, representing the 23.6% retracement of the historical depreciation from 1419.96 to 80.60, and traders are curious to see if ETH/USD can maintain this level. Traders are observing that the 50-bar MA (4-hourly) is bearishly indicating below the 100-bar MA (4-hourly) and above the 200-bar MA (4-hourly). Also, the 50-bar MA (hourly) is bearishly indicating below the 200-bar MA (hourly) and above the 100-bar MA (hourly).
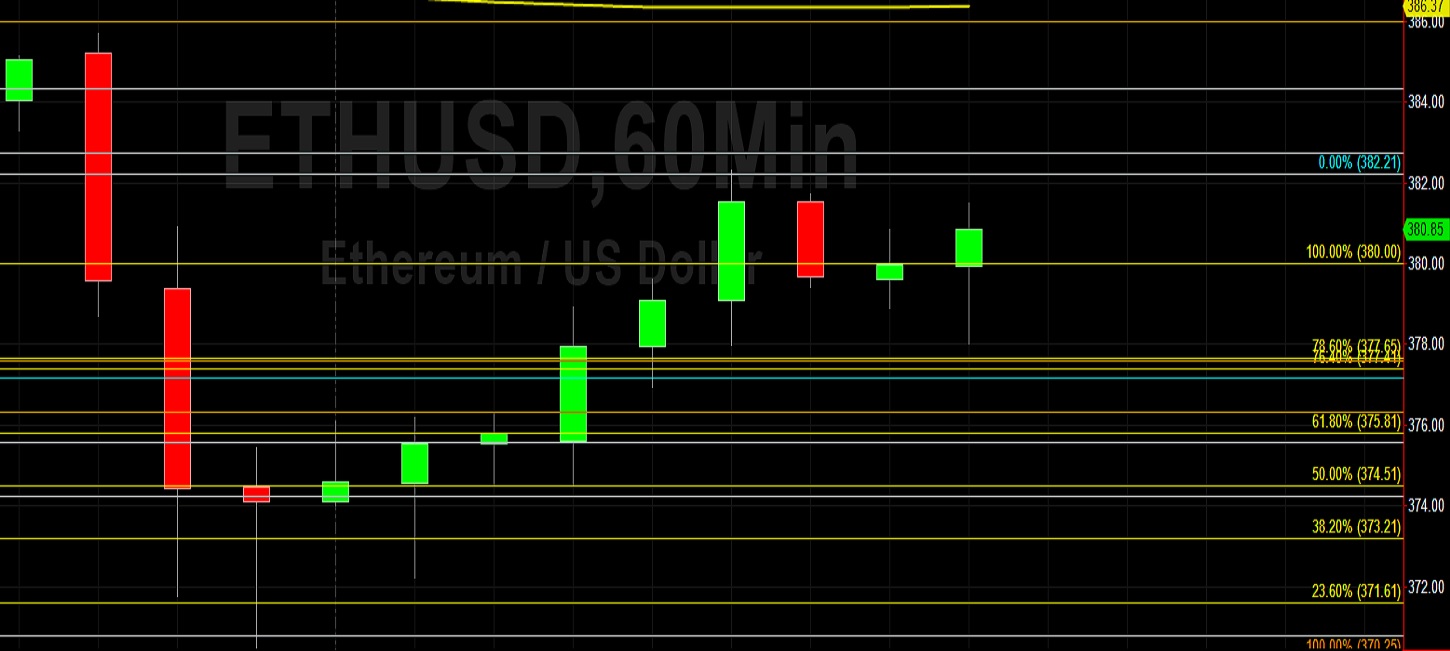
Price activity is nearest the 200-bar MA (4-hourly) at 376.74 and the 100-bar MA (Hourly) at 386.37.
Technical Support is expected around 315.08/ 302.20/ 279.77 with Stops expected below.
Technical Resistance is expected around 421.47/ 437.41/ 454.79 with Stops expected above.
On 4-Hourly chart, SlowK is Bullishly above SlowD while MACD is Bearishly below MACDAverage.
On 60-minute chart, SlowK is Bullishly above SlowD while MACD is Bullishly above MACDAverage.