Crypto Price Analysis for Oct. 14: BTC, ETH, XRP, LTC, BCH

This analysis brought to you by RoboForex.
Bulls have been able to push Bitcoin past the sideways channel, so they may continue pushing it upwards to reach the next target at $12,495. If the asset fixes above this level, it may continue growing towards new highs. It’s very important for bulls to break this level because otherwise there are risks of the formation of a reversal pattern. If this level is not broken, bears may easily drop the cryptocurrency rate. Moreover, similar patterns can be found on charts of other assets, such as Litecoin and Bitcoin Cash, that’s why bulls must update local highs to make the entire cryptocurrency market start a proper rising movement.
Bitcoin
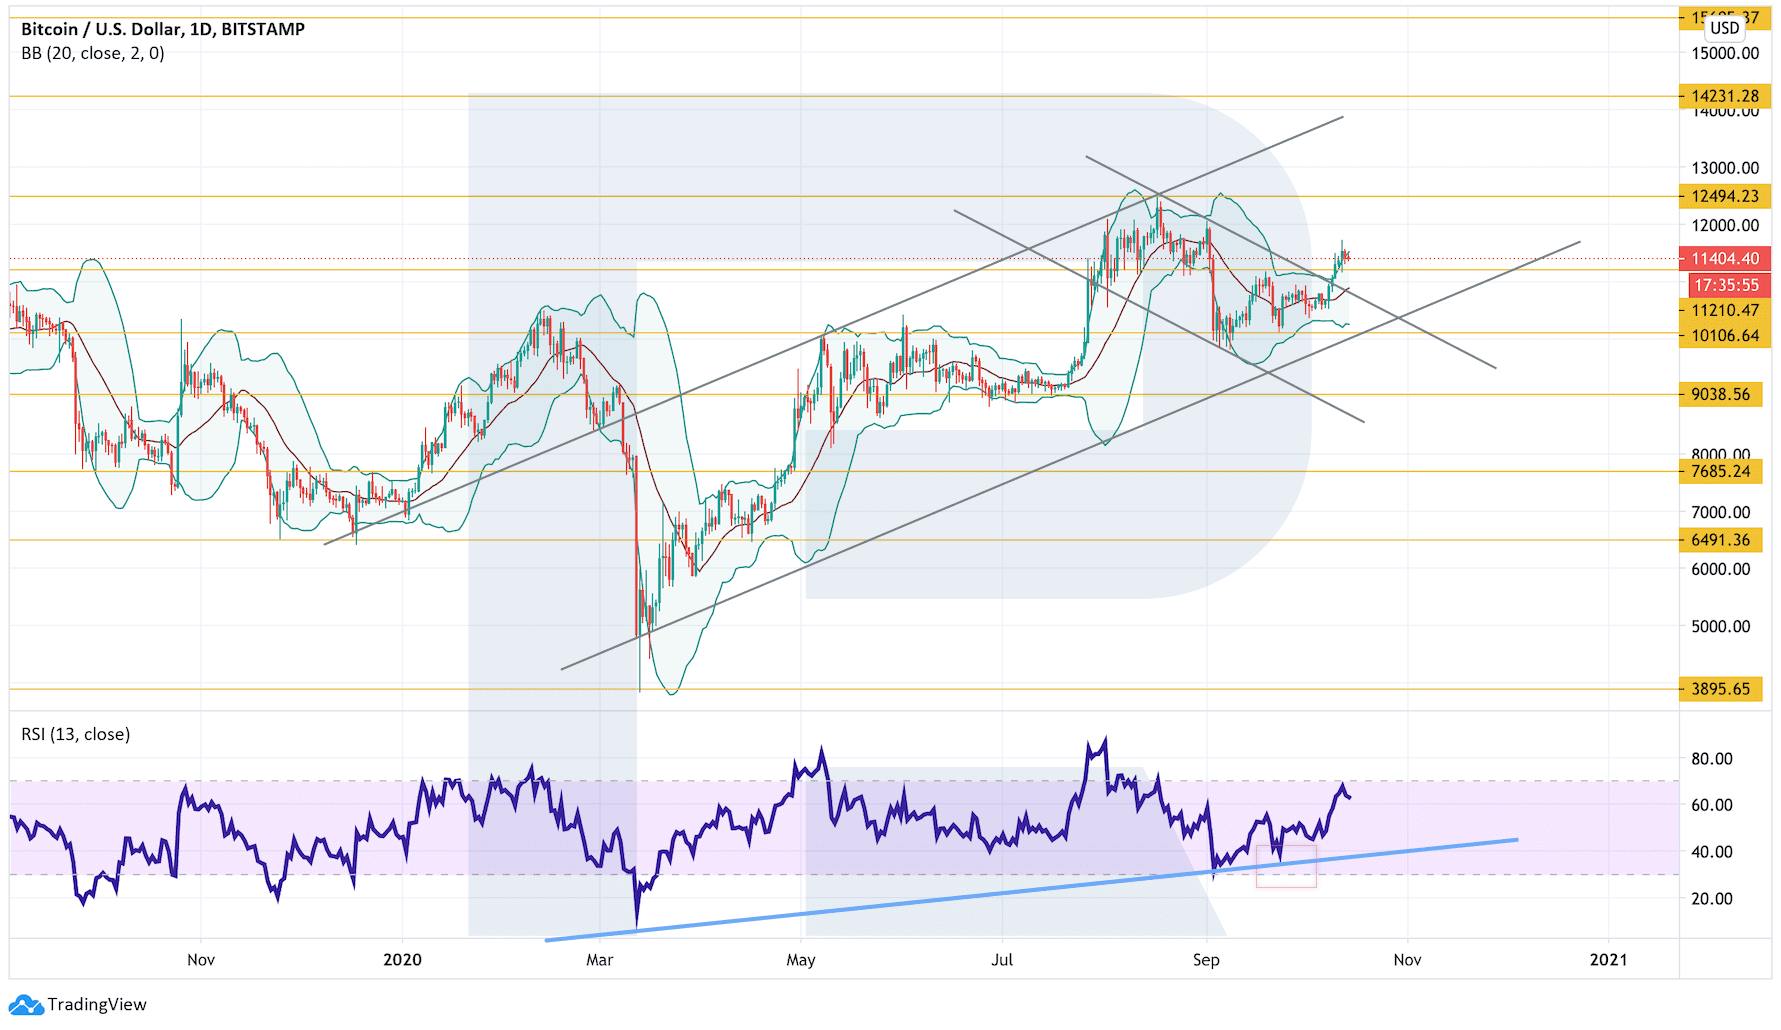
As we can see in the daily chart, after breaking the upside border of the channel, where it had been moving for quite a long time, Bitcoin has fixed above $11,200. The asset has also broken the descending channel’s upside border, which may indicate further growth towards $12,495. Another signal in favor of this idea is that the RSI is also rebounding from the ascending trendline. To confirm this scenario, it’s important for bulls to fix the price above $12,495. Otherwise, the cryptocurrency may break $10,105 and complete the formation of a Head & Shoulders reversal pattern. In this case, the instrument may continue falling with the target of the pattern materialization at $7,000.
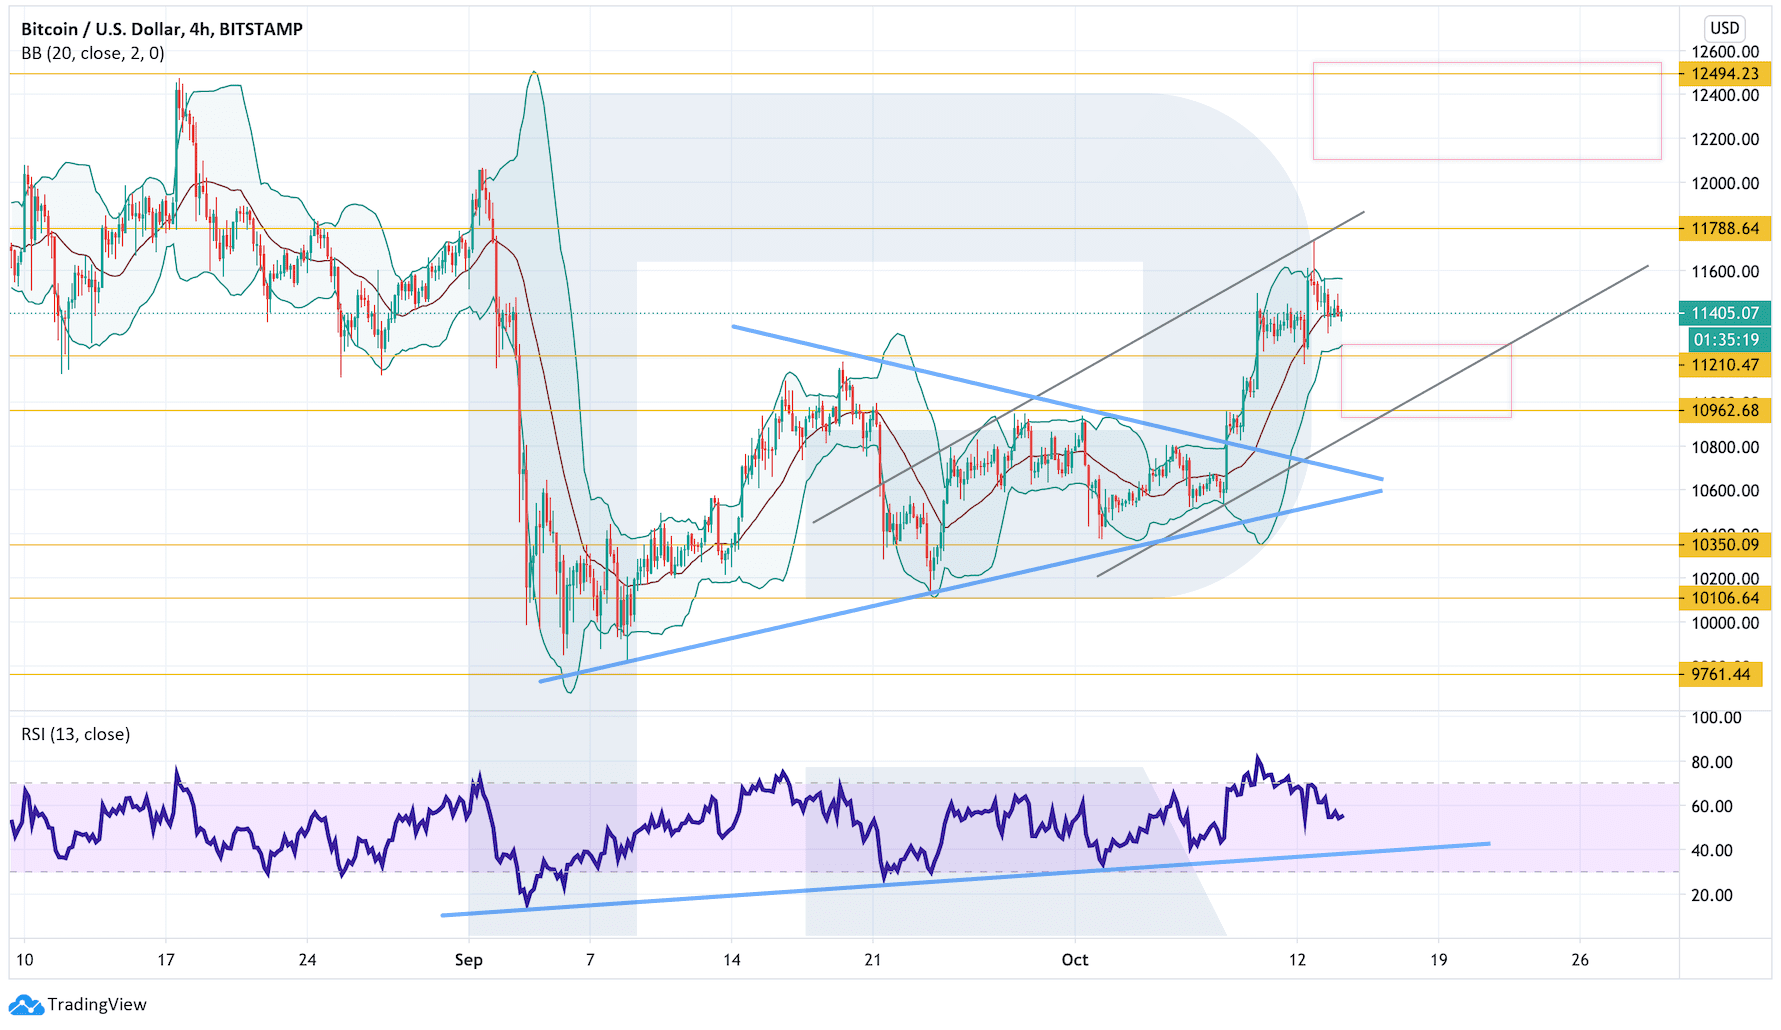
In the H4 chart, the asset is no longer moving inside a Triangle pattern. There are chances to see further growth within the frameworks of the pattern materialization. Another signal in favor of this idea will be a rebound from the rising channel’s downside border on the price chart and the support lien at the RSI. As we can see, the previous test of the trendline at the RSI resulted in a rebound of the price. However, this scenario may be canceled if the asset breaks the rising channel’s downside border and fixes below $10,960. After that, the instrument may continue trading downwards to reach $10,350.
Ethereum
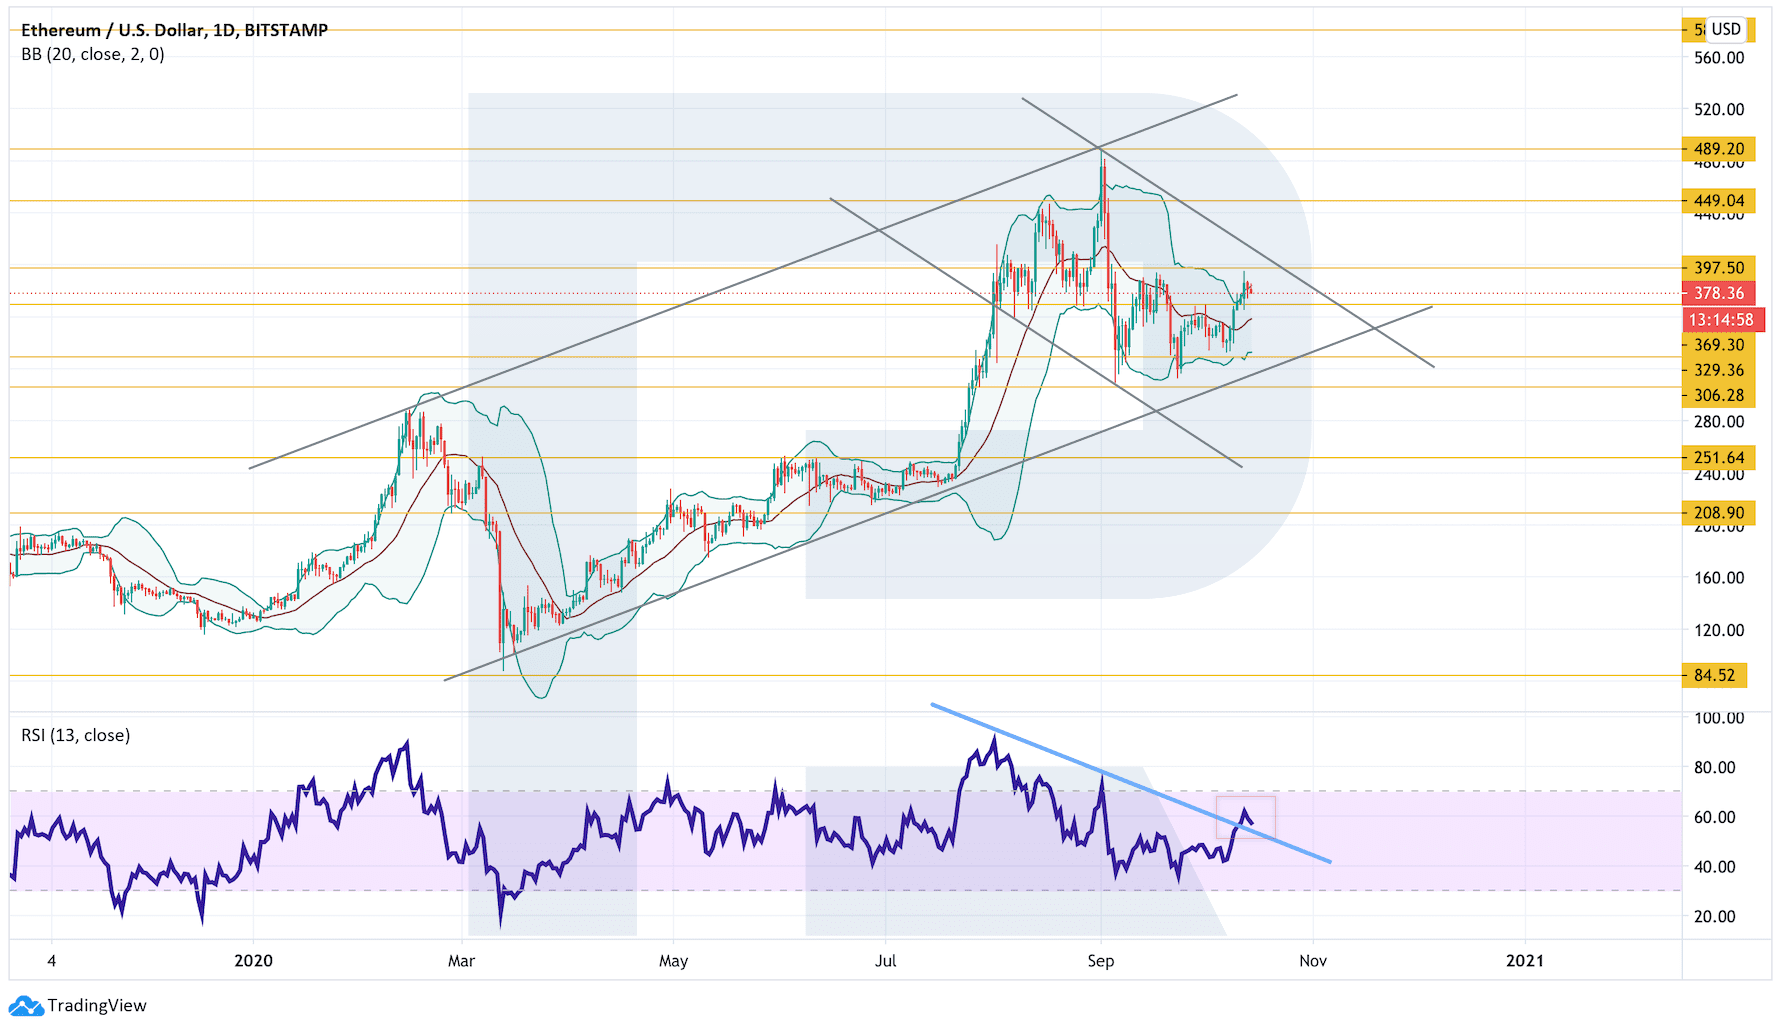
In the daily chart, ETH/USD has rebounded from the support level. After breaking the descending channel’s upside border and fixing above $397, the cryptocurrency resume growing and start the “5-0” pattern materialization. A strong signal in favor of this idea is a breakout of the descending trendline at the RSI: right now, the indicator is returning to the broken line, which may lead to further growth of the price. However, this scenario may no longer be valid if the pair breaks the rising channel’s downside border and fixes below $306. After that, the instrument may continue falling with the target at $208.
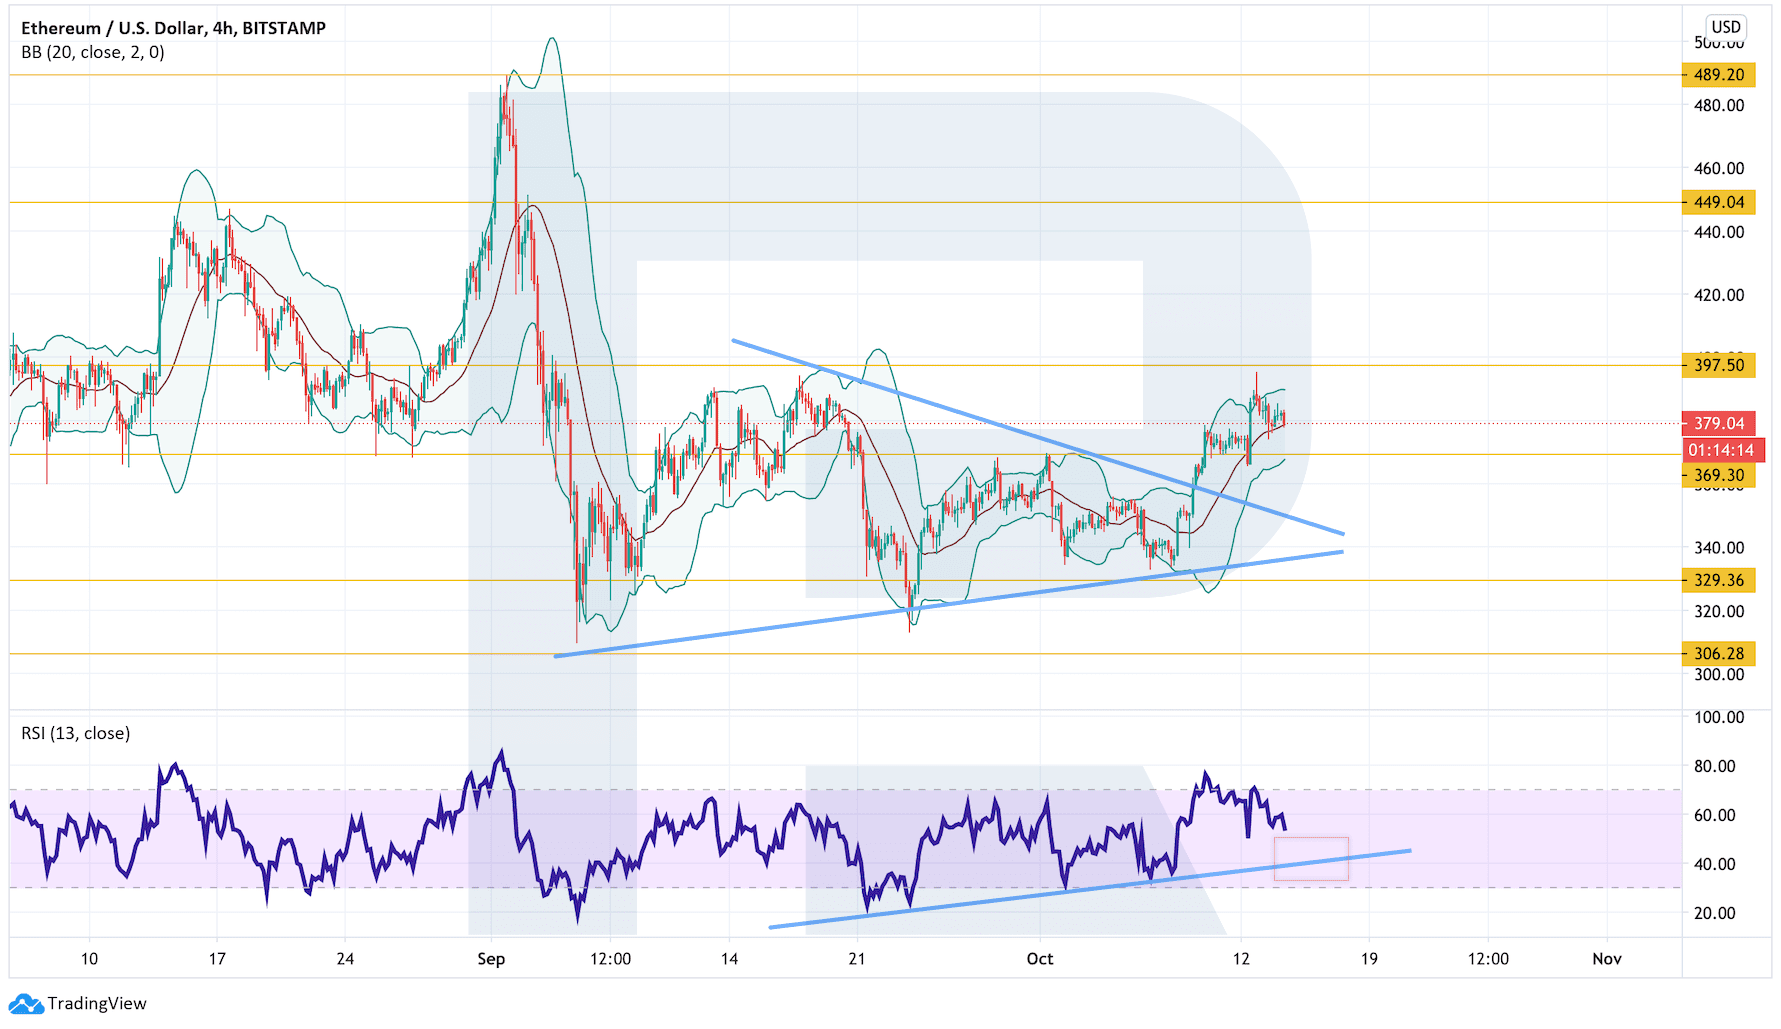
On shorter timeframes, Ethereum has broken the upside border of a Triangle pattern. Possibly, the pair may continue growing towards $450 within the frameworks of the pattern materialization. However, one shouldn’t exclude a possibility of a correction to test the pattern’s upside border and then – further growth. A signal in favor of this idea will be a rebound from the support line at the RSI: as we can see, the previous test resulted in a rebound to the upside and a breakout of the Triangle pattern’ upper border. However, this bullish scenario may be canceled if the price breaks the support area and fixes below $330. In this case, the instrument may continue trading downwards.
Litecoin
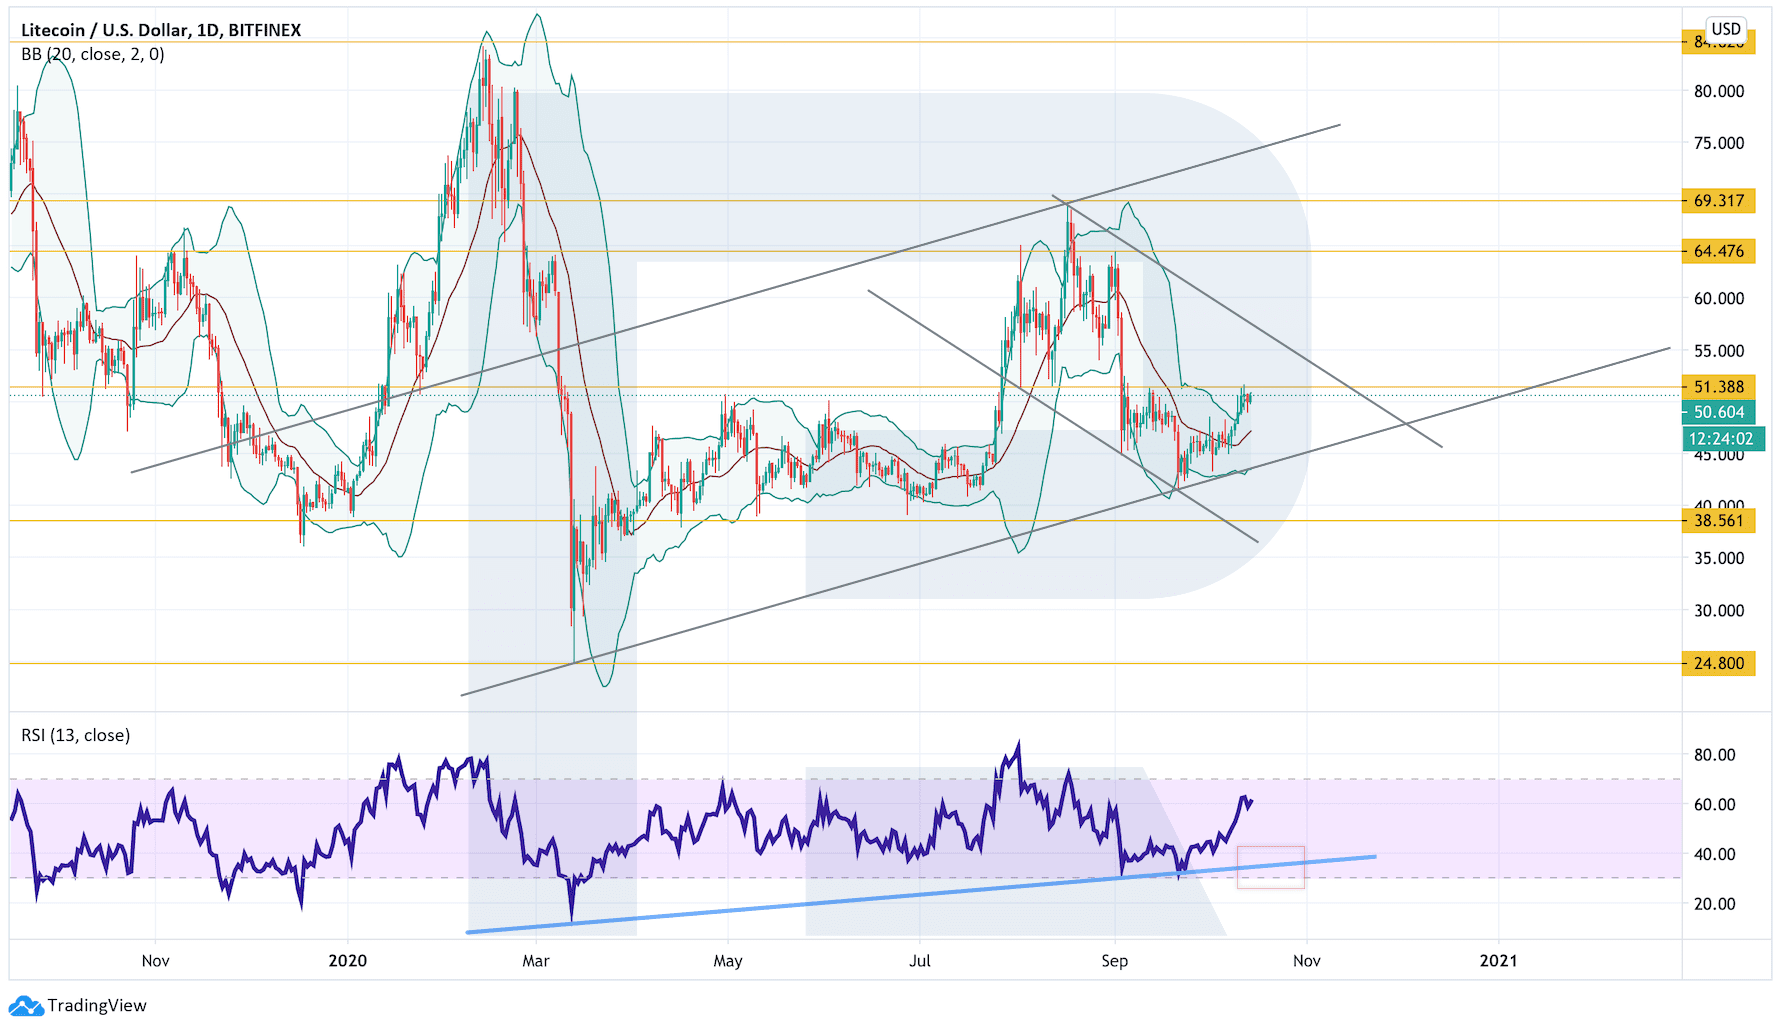
As we can see in the daily chart, Litecoin is still moving upwards and forming a Head & Shoulders reversal pattern. To cancel the pattern, bulls must break $70, thus indicating further growth towards $84. To confirm this trading idea, the asset must break the descending channel’s upside border and fix above $57. However, if bears manage to break the support area and keep the price below $38, the market may continue falling towards $25 and forming a reversal pattern.
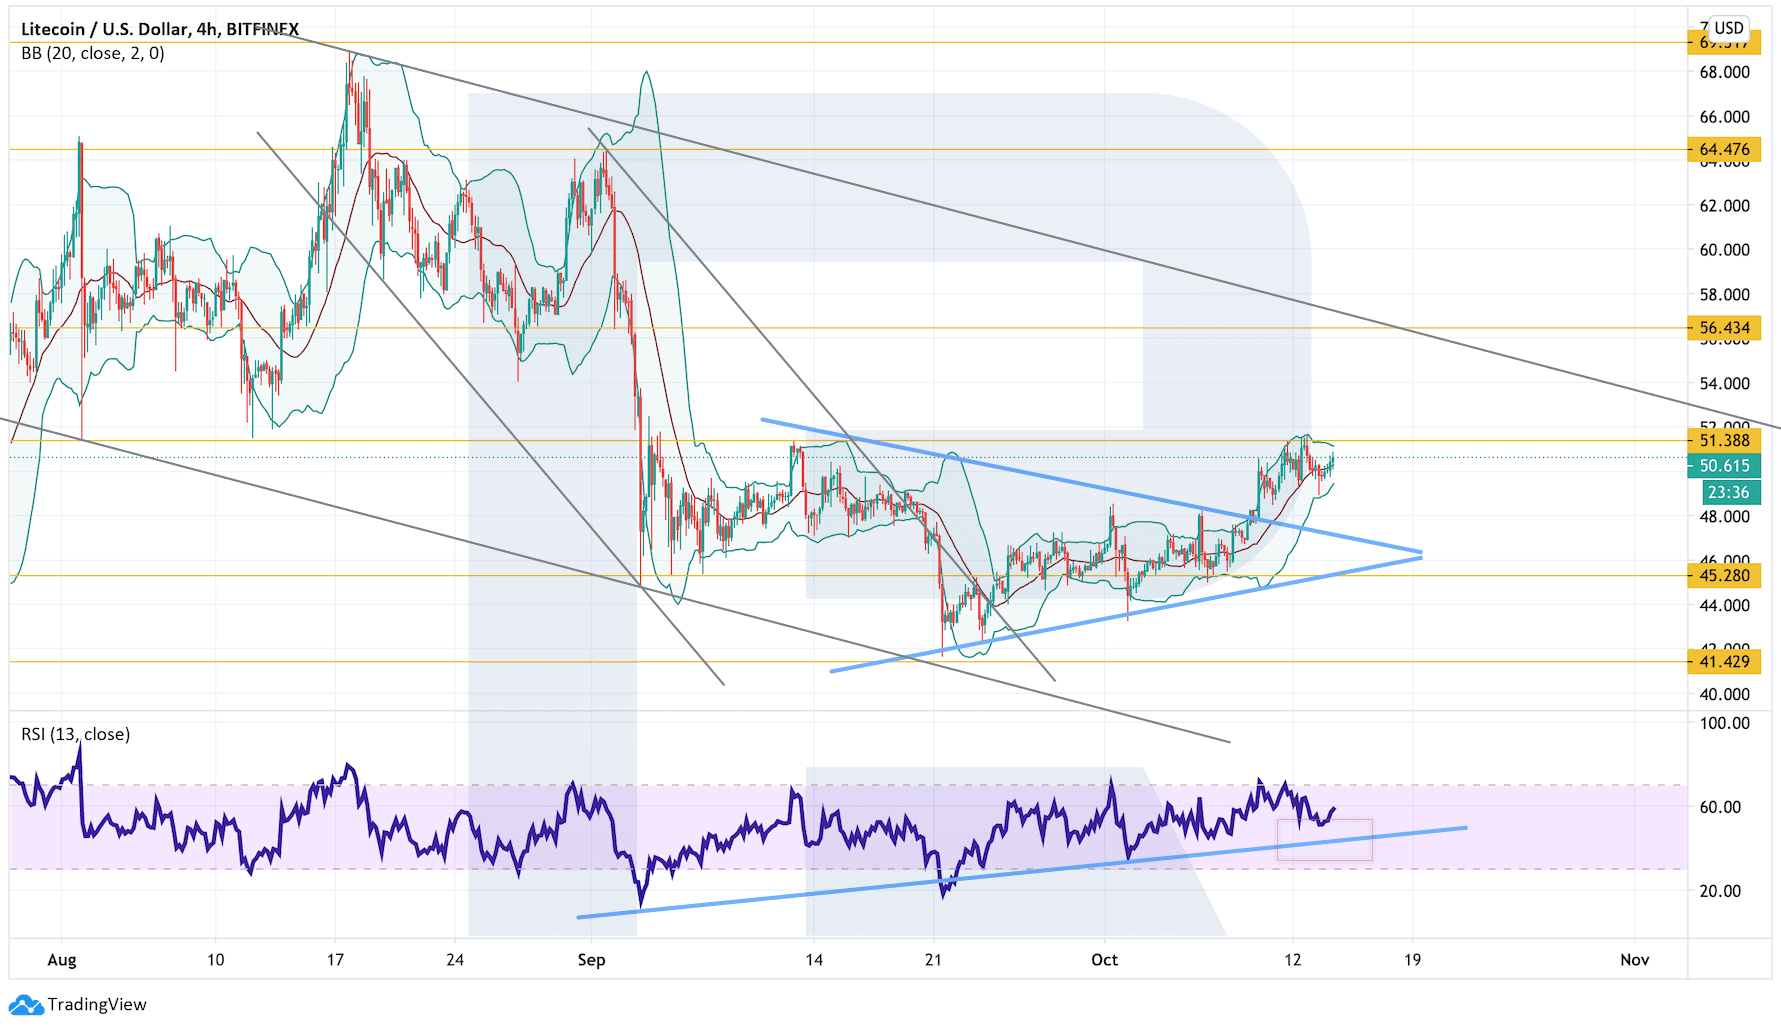
In the H4 chart, the cryptocurrency has left a Triangle pattern. After a slight correction, the asset may continue trading upwards within the frameworks of the pattern materialization. The upside target is at $56. Another signal in favor of this idea will be a rebound from the support line at the RSI. Still, if the market falls and breaks $41, the instrument may continue trading downwards with the target at $35.
XRP
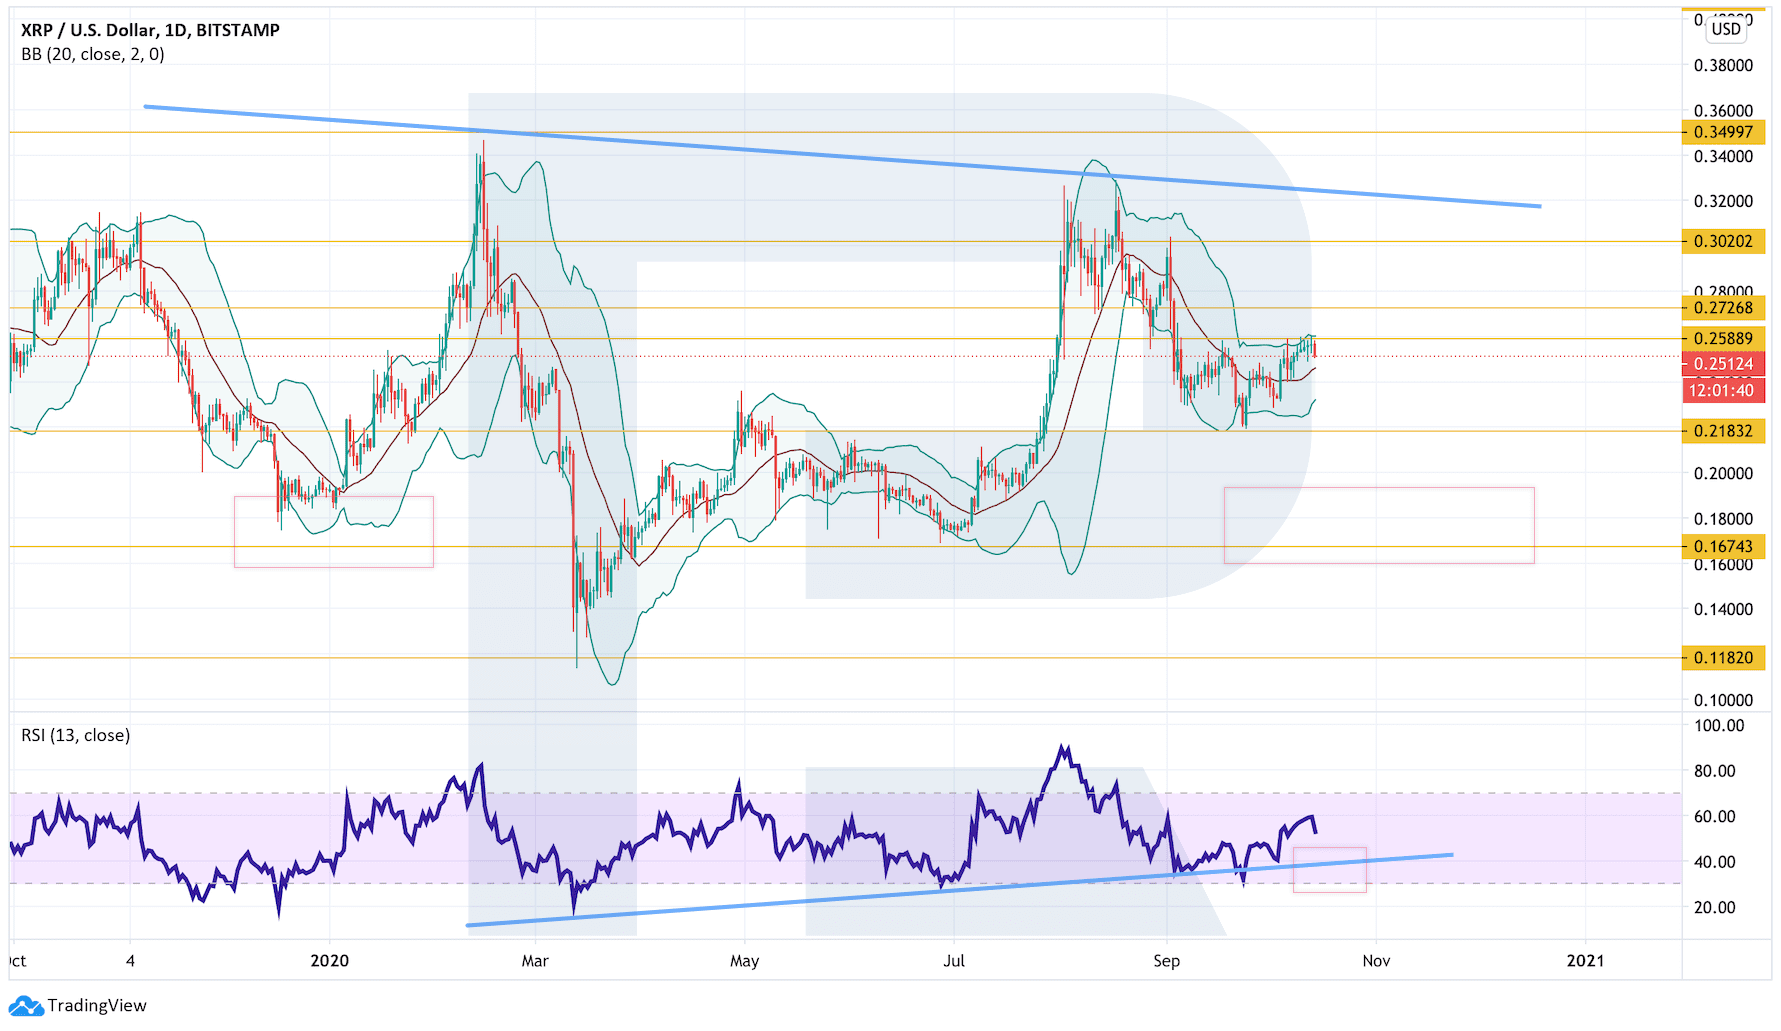
In the daily chart, XRP continues testing the upside border of the Bollinger Bands indicator but has failed to break it yet. Also, the cryptocurrency is forming a large Head & Shoulders reversal pattern. To complete the pattern, the price must test $0.1675. Another signal in favor of this idea will be a rebound from the support line at the RSI.
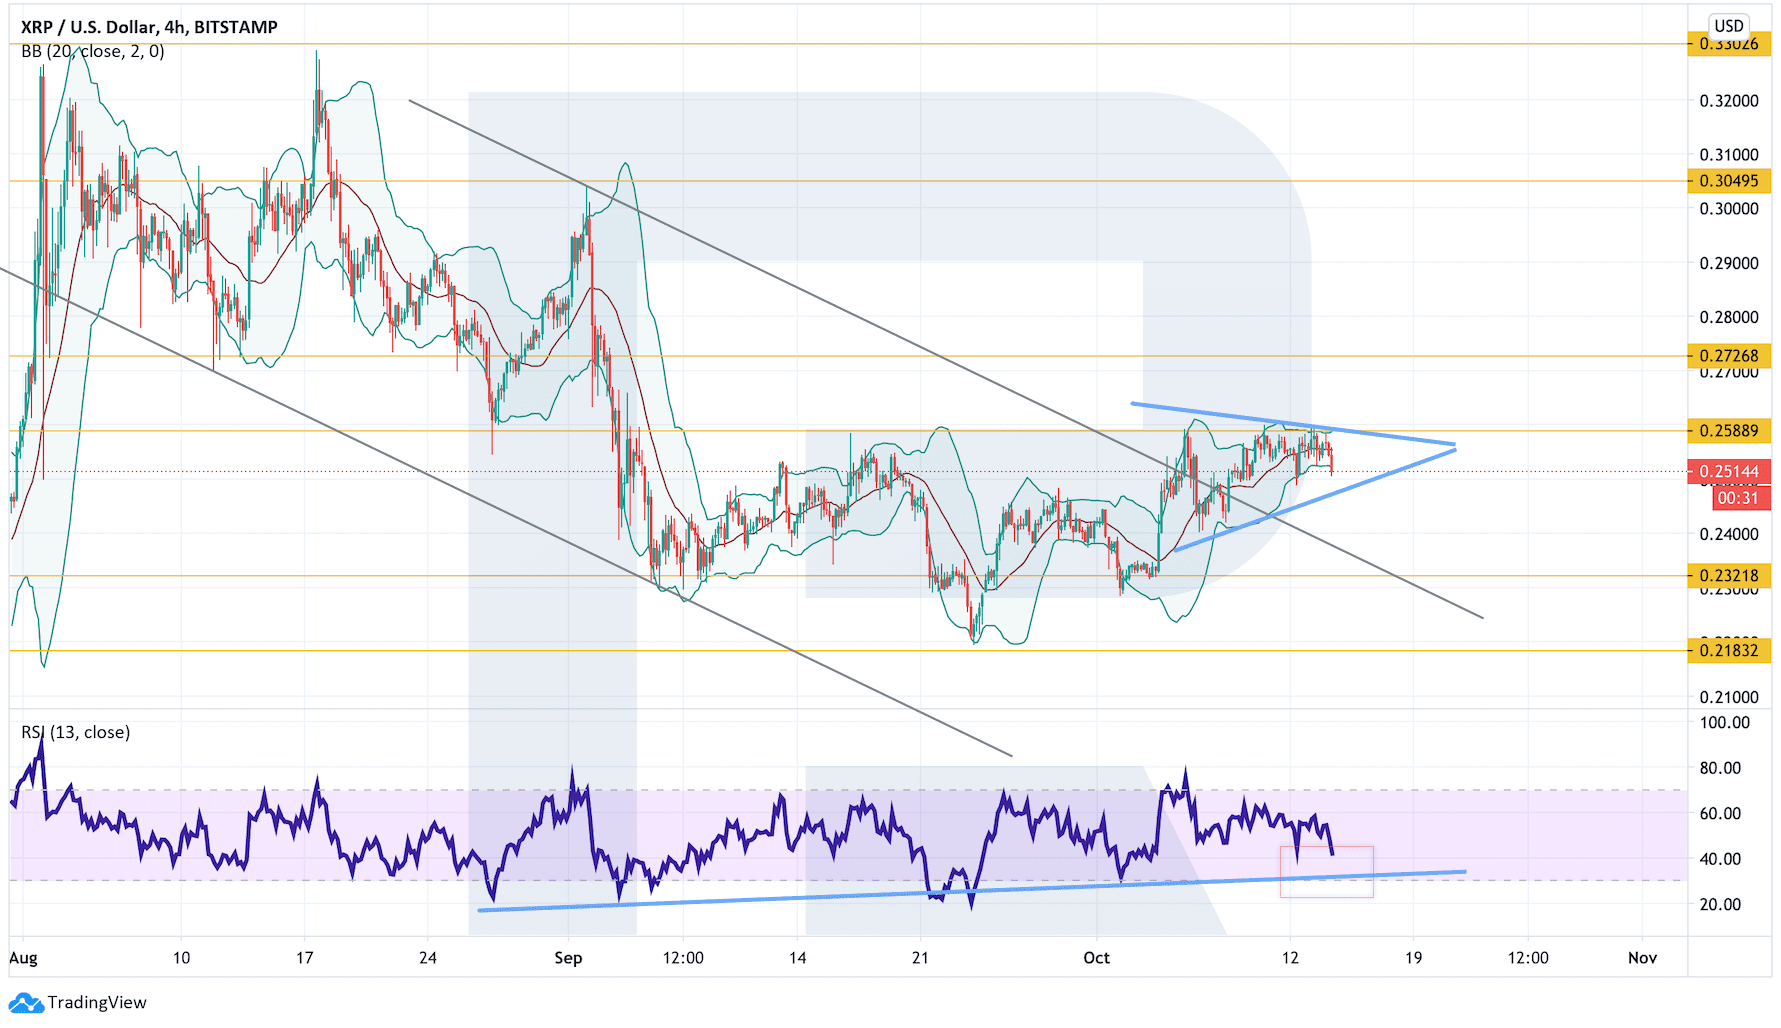
On shorter timeframes, the cryptocurrency is moving within a Triangle pattern. $0.2590 is a very important level here as bulls have failed to break it upwards yet. As a result, one should consider a test of the pattern’s downside border followed by a breakout of the pattern to the upside and then further growth towards $0.3050. one more signal in favor of this scenario will be a rebound from the support line at the RSI. However, this bullish scenario may be no longer valid if the instrument breaks the pattern’s downside border and fixes below $0.2400. In this case, the asset may continue falling to reach $0.2185.
Bitcoin Cash
As we can see in the daily chart, Bitcoin Cash has rebounded from the support area. The next upside target is at $279. A breakout of this level will lead to further growth towards $338 where the cryptocurrency may break the descending channel’s upside border. This might be a strong signal for the price to continue moving upwards. However, if the asset rebound from the descending trendline and fix below $199, the instrument may continue trading downwards with the target at $140.

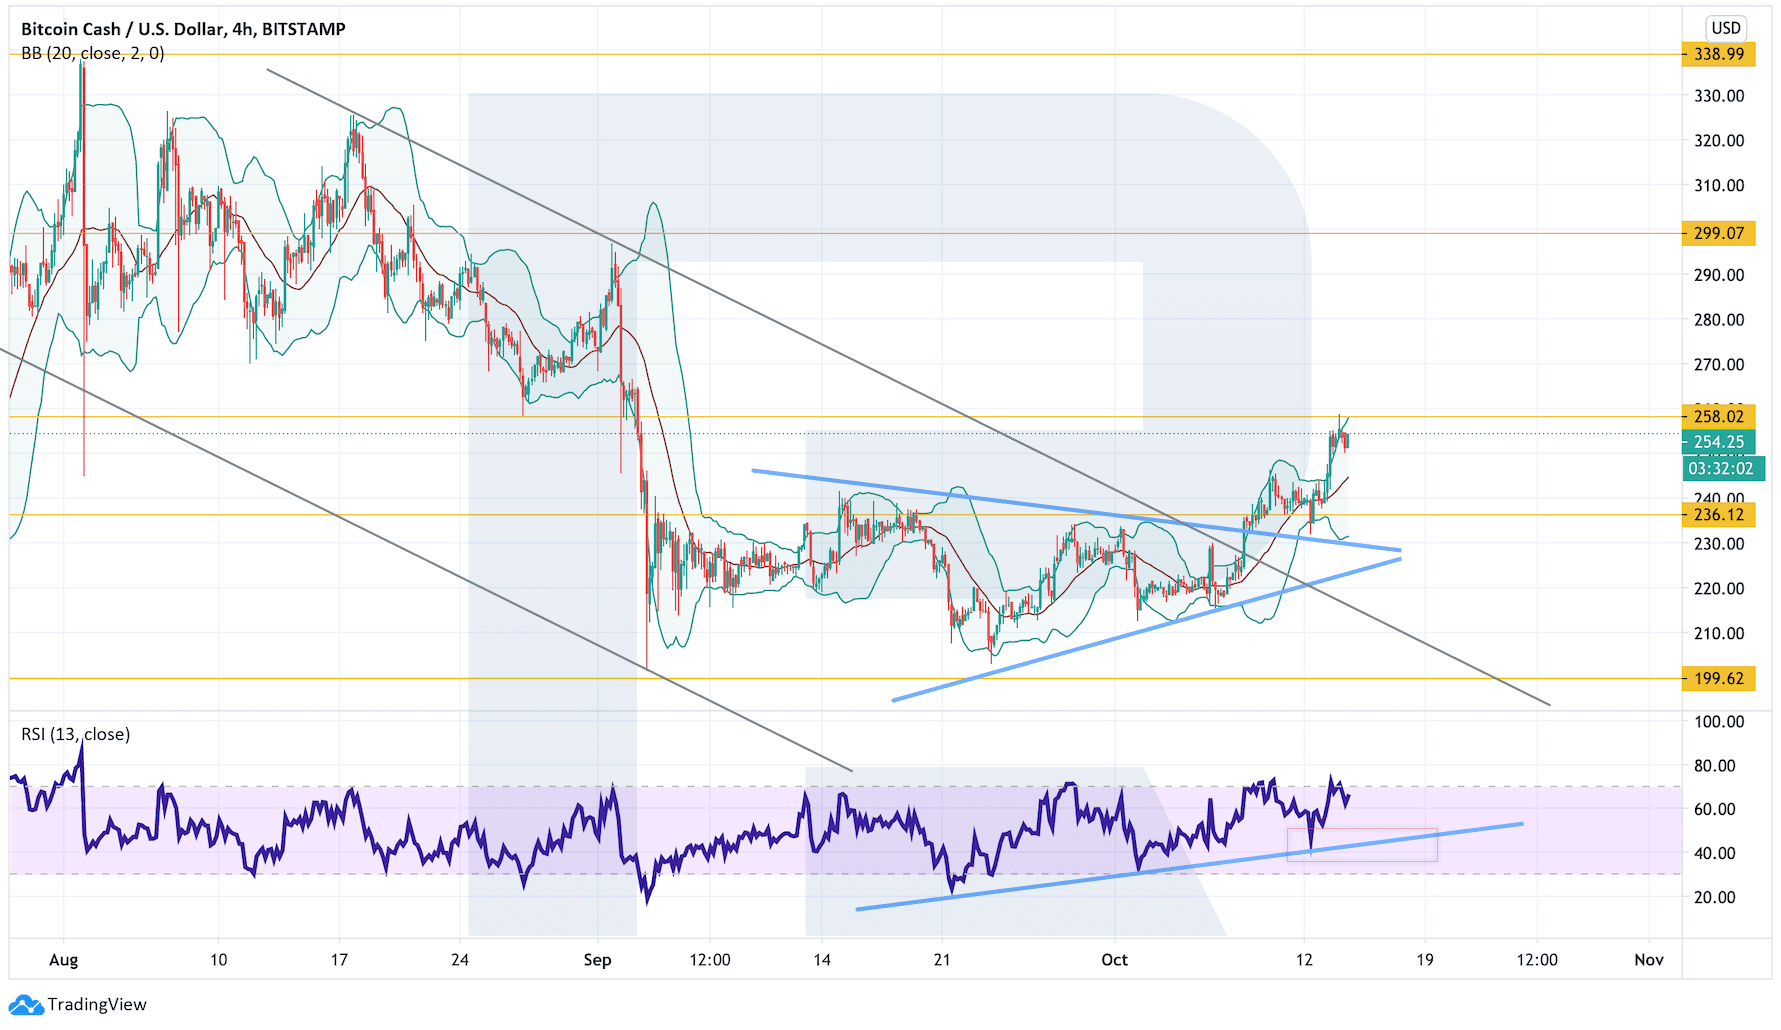
In the H4 chart, the cryptocurrency is no longer moving within a Triangle pattern: the price has broken it to the upside and may continue growing within the frameworks of the pattern materialization. The upside target is at $299. To confirm this scenario, the asset must break the resistance area and fix above $258. Another signal in favor of this idea will be a rebound from the support line at the RSI. However, this scenario may be canceled if the market breaks the support area and fixes below $199. After that, the instrument may resume falling.
By Dmitriy Gurkovskiy, Chief Analyst at RoboForex
Disclaimer
Any predictions contained herein are based on the author's particular opinion. This analysis shall not be treated as trading advice. RoboForex shall not be held liable for the results of the trades arising from relying upon trading recommendations and reviews contained herein.
© 2020 CryptoDaily All Rights Reserved. This article is provided for informational purposes only. It is not offered or intended to be used as legal, tax, investment, financial, or other advice.
