Bitcoin (BTC/USD) added to yesterday’s gains early in today’s Asian session as the pair traded as high as the 9918.16 level after gaining ground to the 10025.66 area during yesterday’s European session. Strong buying activity lifted the pair from the 9677.83 area during yesterday’s Asian session, helping the pair move beyond a recent tight trading range. One important level close to the pair’s high during yesterday’s move higher is the 10017.50 area, an upside price objective. The 10239.21 and 10513.53 areas are the next upside price objectives related to this level. The pair had recently traded in a sideways manner after trading as low as the 9280.98 area, following its rapid crash from the 10315.00 area last week. BTC/USD had traded between the 9393.39 and the 9769.66 level since its recent low, an indication that traders are trying to discern a possible shift in market sentiment.
During the pair’s rapid descent last week, Stops were elected below the 9369.61 level, an area that represents the 50% retracement of the move from 8216.71 to 10522.51. The next downside levels in that range are the 9097.53 and 8760.88 levels, representing the 61.8% and 76.4% retracements. Traders and chartists are also carefully watching other downside price levels, including the 9118.37 and 8722.47 areas. Both of these levels represent price extensions related to a relative high around the 10400 figure and subsequent selling pressure around the 10004.46 area. During last week’s rapid descent, the pair briefly traded below its 200-bar MA (4-hourly) before recovering, and has since traded between the 50-bar MA (4-hourly) and 100-bar MA (4-hourly). Below current market activity, traders anticipate bids around the 9169.41, 8911.79, and 8739.96 areas. Above current market activity, traders anticipate offers around the 10167, 10215, and 10397 levels.
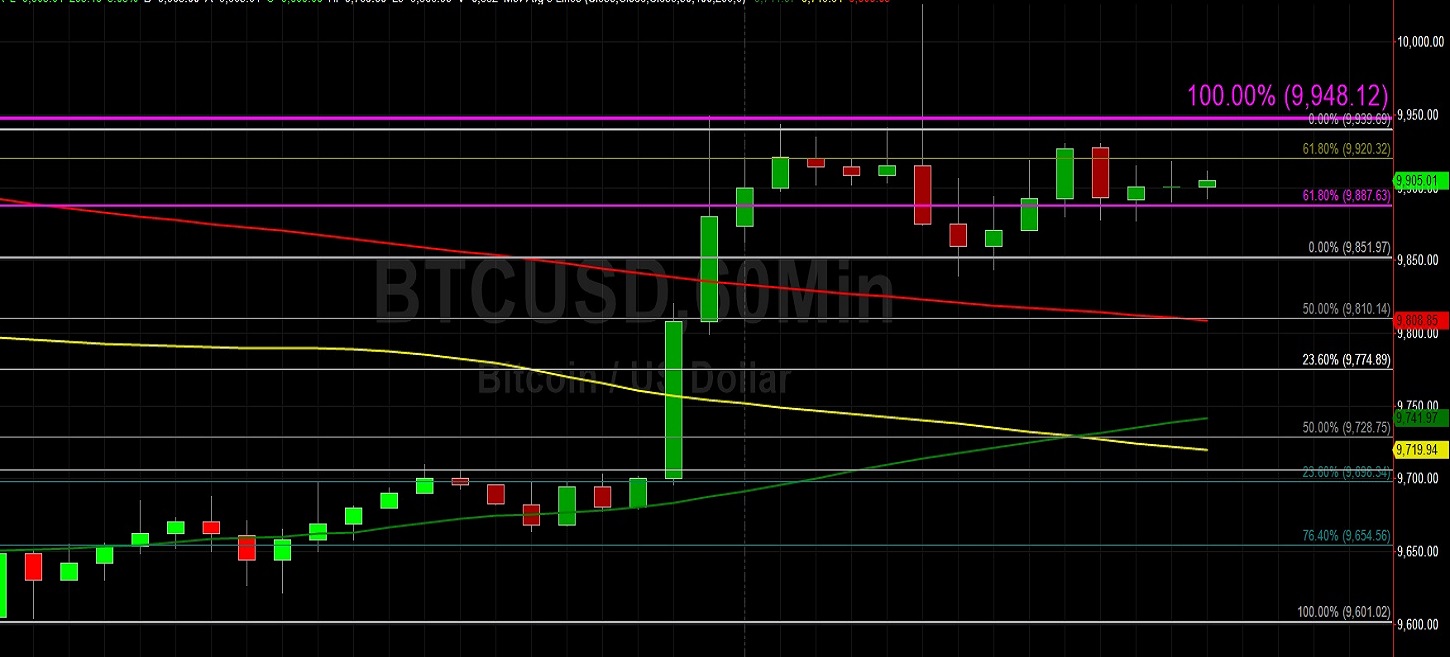
Price activity is nearest the 100-bar MA (4-hourly) at 9945.55 and the 200-bar MA (Hourly) at 9808.87.
Technical Support is expected around 9370.10/ 9121.40/ 8760.28 with Stops expected below.
Technical Resistance is expected around 10534.04/ 10652.04/ 10698.24 with Stops expected above.
On 4-Hourly chart, SlowK is Bearishly below SlowD while MACD is Bullishly above MACDAverage.
On 60-minute chart, SlowK is Bearishly below SlowD while MACD is Bearishly below MACDAverage.
Ethereum (ETH/USD) appreciated early in today’s Asian session as the pair traded as high as the 272.60 level after traders pushed the pair to the 275.79 area during yesterday’s European session. Prior to yesterday’s run-up in prices, the pair had been trading in a very narrow range following its depreciation to the 245.25 level last week after the pair failed to get back above the 287.13 level. During its struggle to claw back some lost ground after its move to the 245.25 area, the pair was unable to get back above the 268.71 area but thereafter has remained bid above the 256.30 level. This tight range suggests traders are waiting to determine if there has been a change in market sentiment.
Chartists have observed that the pair is back trading above the 50-bar MA (4-hourly), and continues to trade above the 200-bar MA (hourly) which is bullishly converging with the 50-bar MA (hourly). Traders continue to monitor some additional downside levels related to the recent depreciation from the 290.00 level and these include the 255.97, 247.94, and 237.98 areas. Below current market activity, traders are anticipating possible technical support around the 234, 230, 220, and 216 levels. Above current market activity, traders are anticipating technical offers around the 281, 293, 302, and 307 levels.
Price activity is nearest the 50-bar MA (4-hourly) at 265.08 and the 200-bar MA (Hourly) at 265.28.
Technical Support is expected around 230.27/ 226.38/ 222.73 with Stops expected below.
Technical Resistance is expected around 296.15/ 304.10/ 312.93 with Stops expected above.
On 4-Hourly chart, SlowK is Bearishly below SlowD while MACD is Bullishly above MACDAverage.
On 60-minute chart, SlowK is Bearishly below SlowD while MACD is Bearishly below MACDAverage.