27 January 2020 - ETC/ EUR – Hourly
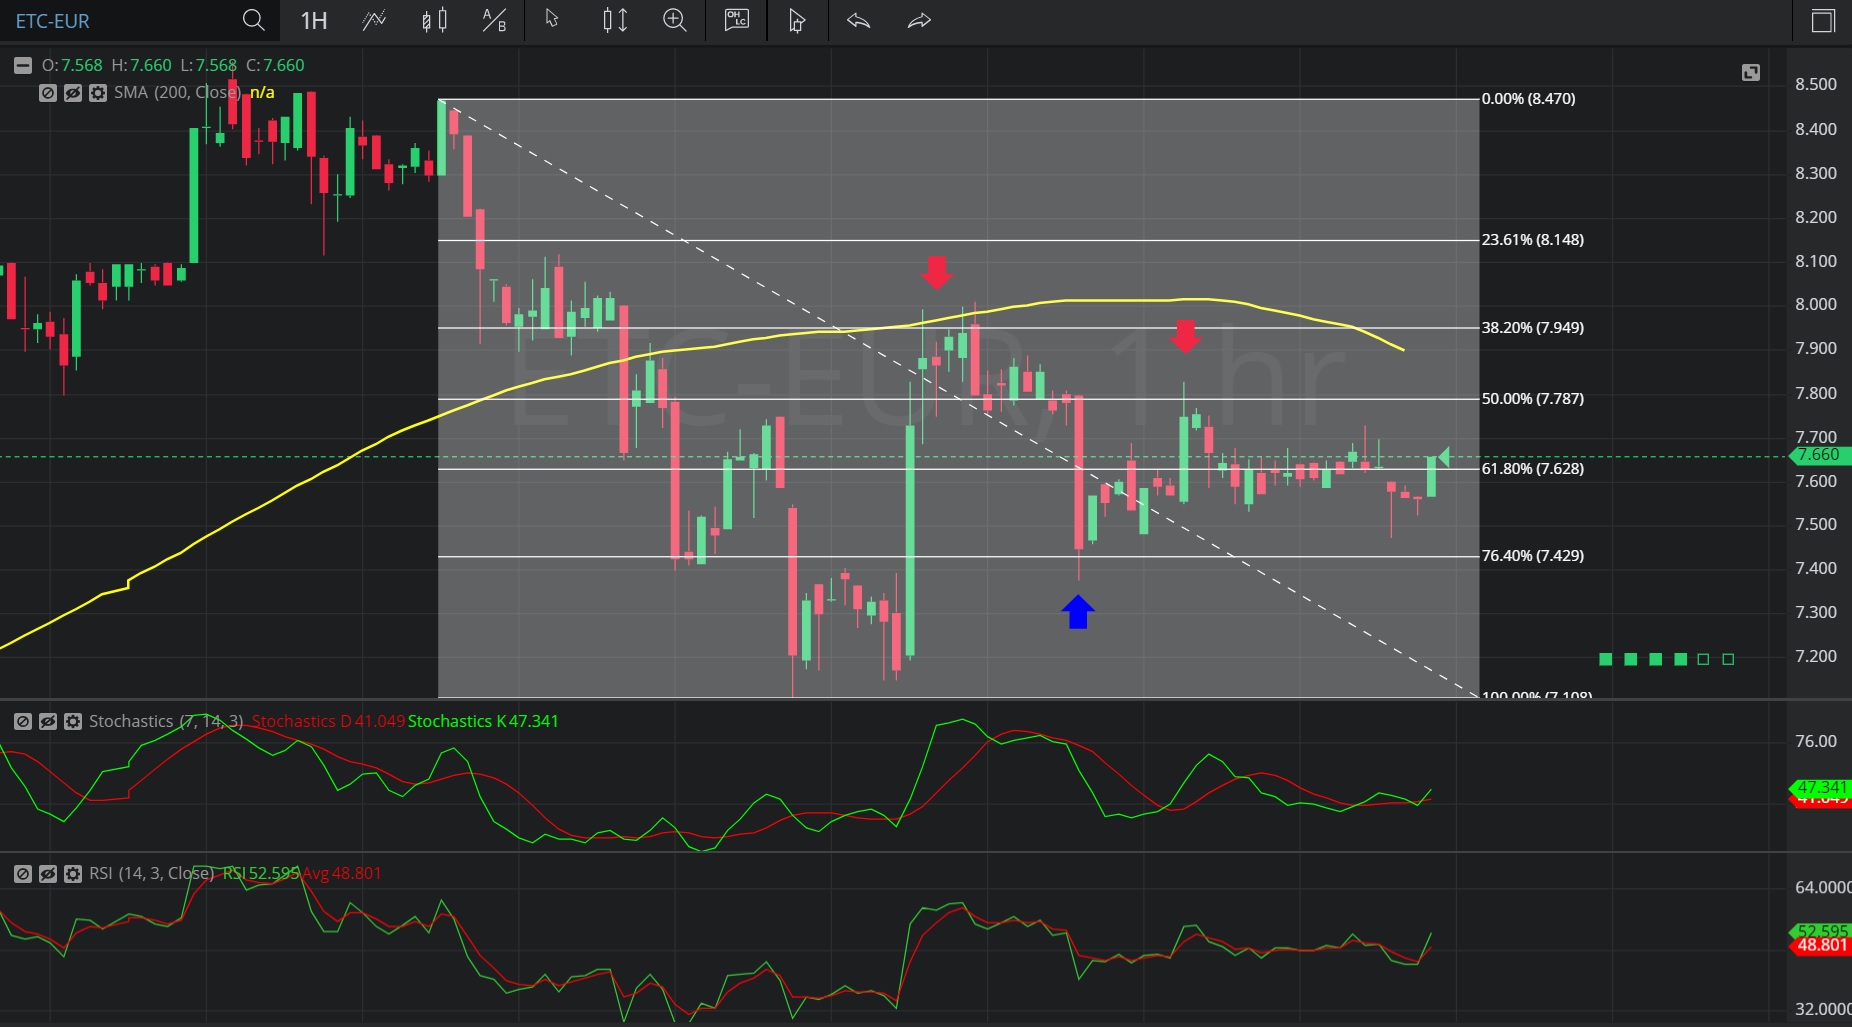
In this Hourly chart of Ethereum Classic / Euro (ETC/ EUR), there is a depreciating range from 8.469 to 7.111.
We can observe that the market then appreciated to the 8.012 level (identified by the first red down arrow), just above the 7.950244 level that represents the 61.8% retracement of the depreciating range.
We can observe that this was also very close to the 200-bar Simple Moving Average (identified in yellow).
We can observe that the market then depreciated to the 7.377 level (identified by the blue up arrow), just below the 7.431488 level that represents the 23.6% retracement of the depreciating range.
We can observe that the market then appreciated to the 7.831 level (identified by the second red down arrow), just above the 7.79 level that represents the 50% retracement of the depreciating range.
We can observe that the market then depreciated to the 7.474 level.
Using RSI, we can observe that the slope of RSI (14) and the slope of RSI Average (3) turned negative after the market traded as high as 8.012. We can also observe that RSI Average (3) bearishly moved above RSI (14), indicating price depreciation.
Using Slow Stochastics, we can observe that the slope of Stochastics K turned negative after the market traded as high as 8.012. We can also observe that Stochastics D bearishly moved above Stochastics K, and that the slope of Stochastics D turned negative, indicating price depreciation.
Stay on top of the cryptocurrency market with CryptoDaily’s trading charts!
