Bitcoin
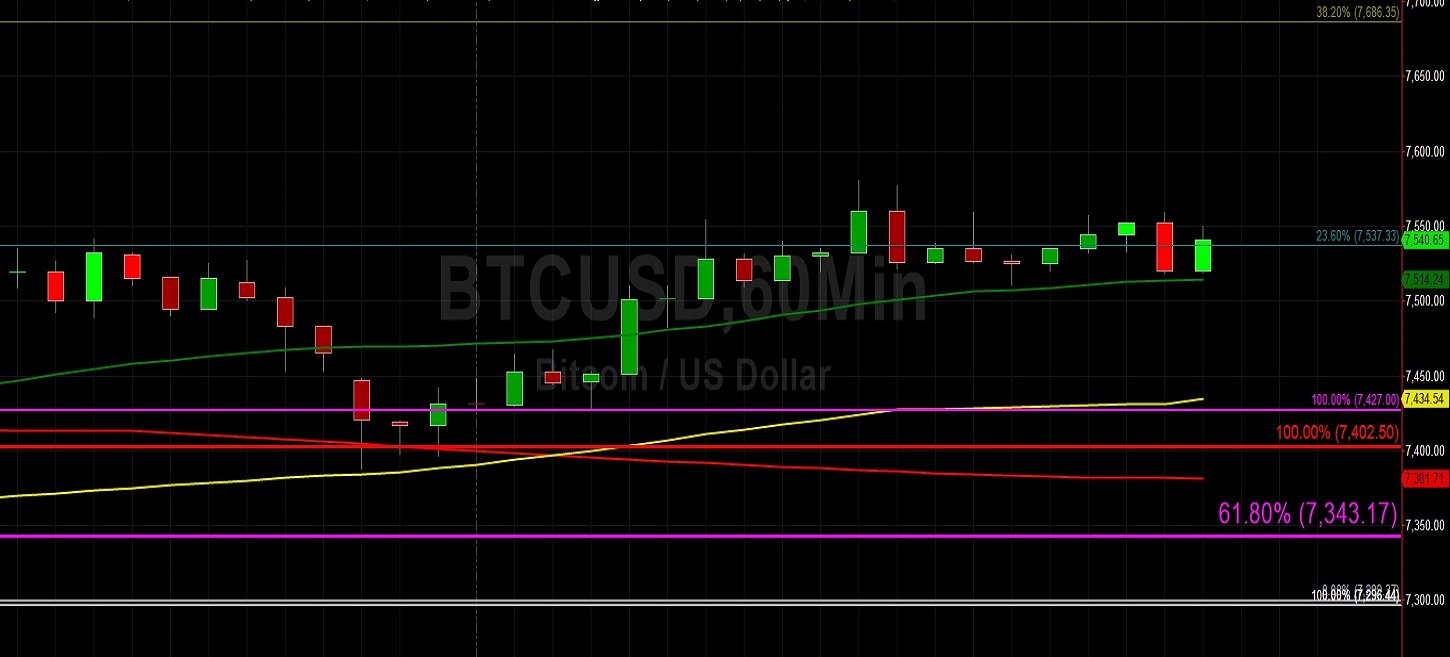
Bitcoin (BTC/USD) weakened early in today’s Asian session as the pair fell to the 7518.38 level after trading as high as the 7580.84 level during yesterday’s North American session. Market sentiment appears to be at least marginally shifting in favour of BTC/USD Bulls following the pair’s recent moves above the 7552.89 area, a level that represents the 23.6% retracement of the 6526.00 – 7870.10 area. Technicians are curious to see if the pair can remain above the 7473.42 area, a level that represents the 23.6% retracement of the 10540.49 – 6526.00 range. Additional similar important retracement levels related to depreciations from recent highs include the 7568.81 area, 7893.48 area, 8101.78 area, and 8258.82 area.
If the upward trajectory can be sustained, some levels will come into focus again including the 7884.76, 8304.27, 8723.78, and 9242.83 areas, all of which are upside price objective targets. Another level that traders are carefully watching is the 7594.48 area, a downside price objective related to the late-October high of 10540.49. The 7594.48 level’s technical significance was confirmed on 21 November when Stops were elected below the level during a sharp depreciation and if the market will be able to tackle additional upside targets, traders must advance past this level. Another upside target that traders may challenge is the 8289.82 level, an area that represented a downside price objective target related to the 10540.49 relative high from late October. Given the volume of Stops triggered below this level on 18 November, traders anticipate some Stops to be in place above the 8289.82 area.
Price activity is nearest the 50-bar MA (4-hourly) at 7,375.05 and the 500-bar MA (Hourly) at 7,514.33.
Technical Support is expected around 6775.47/ 6653.57/ 6323.42 with Stops expected below.
Technical Resistance is expected around 7870.10/ 8062.04/ 8338.78 with Stops expected above.
On 4-Hourly chart, SlowK is Bullishly above SlowD while MACD is Bullishly above MACDAverage.
On 60-minute chart, SlowK is Bearishly below SlowD while MACD is Bullishly above MACDAverage.
Ethereum
Ethereum (ETH/USD) gave back some gains early in today’s Asian session as the pair fell to the 150.42 area after trading as high as the 152.00 figure during yesterday’s North American session. Traders are waiting to see if the pair can build a constructive base above the 147.78 level, an area it has recently orbited that represents the 23.6% retracement of the 199.50 – 131.80 range. The next upside price objective target related to this range is the 157.66 area, representing the 38.2% retracement of the same range. Additional levels that traders are monitoring to assess the pair’s relative strength include the 153.36, 157.21, and 175.88 areas, all of which are 23.6% retracement levels related to relative highs including the 224.34, 239.45, and 318.60 levels.
If ETH/USD Bulls are able to extend their recent upside progress, traders will closely track the 160.15 and 161.39 areas, both of which are upside price objectives originating from the recent 131.80 low. The 168.91 and 170.53 areas are additional upside targets, but before some of these levels are challenged traders will need to first move above some selling pressure. Offers are likely ahead of the 152.16 and 156.99 areas with additional selling pressure likely below the 163.35 and 165.11 levels. These areas represent downside price objectives related to the relative high of 199.50 from late October.
Price activity is nearest the 100-bar MA (4-hourly) at 148.77 and the 50-bar MA (Hourly) at 148.69.
Technical Support is expected around 144.77/ 141.74/ 140.61 with Stops expected below.
Technical Resistance is expected around 155.50/ 158.90/ 162.93 with Stops expected above.
On 4-Hourly chart, SlowK is Bullishly above SlowD while MACD is Bullishly above MACDAverage.
On 60-minute chart, SlowK is Bearishly below SlowD while MACD is Bullishly above MACDAverage.
Investment Disclaimer


