Bitcoin
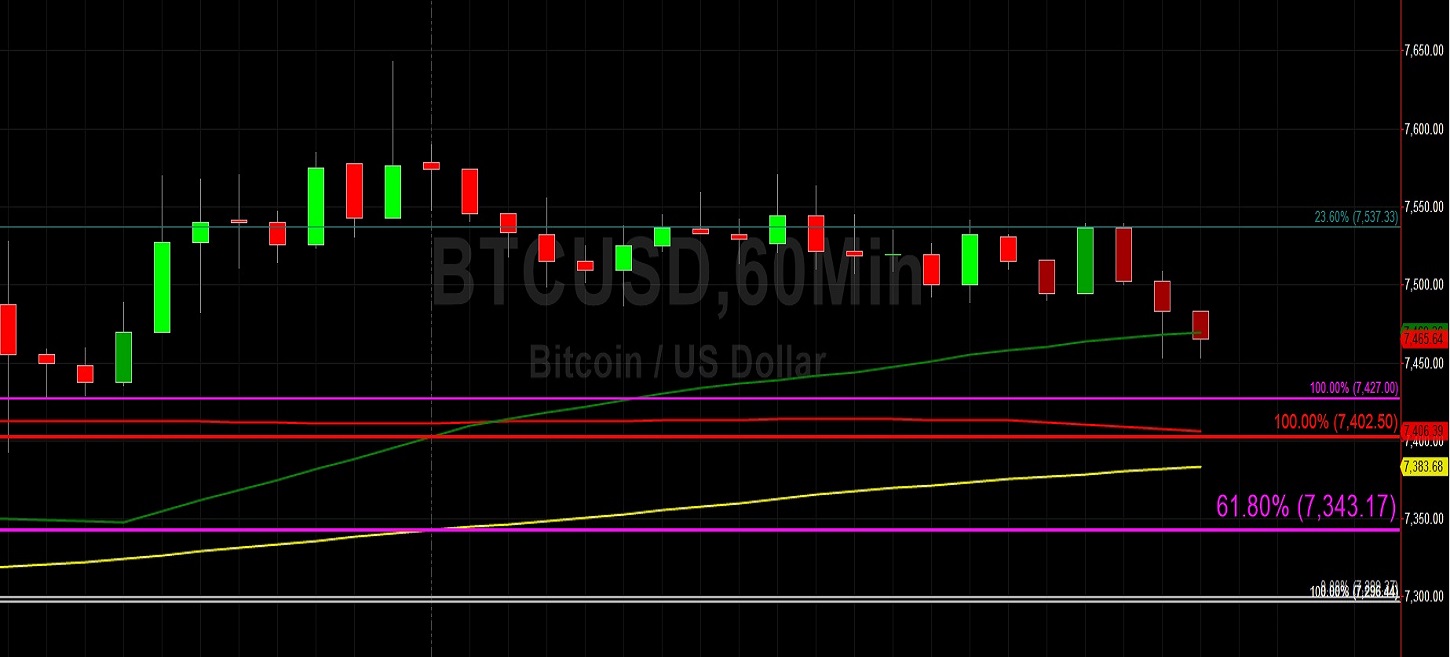
Bitcoin (BTC/USD) weakened early in today’s Asian session as the pair slid to the 7453.38 area after steadily declining from the 7643.00 level during yesterday’s Asian session. Traders continue to observe the market’s attempts to keep BTC/USD trading above the 7039.45 area, a level that represents the 61.8% retracement of the 6256.00 – 7870.10 range. The pair has recently traded above and below the 7198.05 area, representing the 50% retracement of the same range. If traders are able to resume some of the upside buying pressure, the 7552.89 area could come into focus again, representing the 23.6% retracement of the same range and an area that was tested last week during the pair’s quick spike to the 7775.00 level.
If BTC/USD Bulls are able to extend some upside momentum that has pushed the pair higher from the recent low around the 6526.00 area, traders will pay attention to levels including the 7884.76, 8304.27, and 8723.78 areas. These areas represents upside price objective targets and they open up a possible move to the 9242 and 10081 levels. If BTC/USD Bears resume their recent downside momentum that recently pushed the pair to the 6526 level, traders will focus on the 6653, 6538, 6323, 5733, and 4738 areas as downside price targets.
Price activity is nearest the 50-bar MA (4-hourly) at 7,395.55 and the 50-bar MA (Hourly) at 7,469.36.
Technical Support is expected around 6775.47/ 6653.57/ 6323.42 with Stops expected below.
Technical Resistance is expected around 7870.10/ 8062.04/ 8338.78 with Stops expected above.
On 4-Hourly chart, SlowK is Bearishly below SlowD while MACD is Bullishly above MACDAverage.
On 60-minute chart, SlowK is Bearishly below SlowD while MACD is Bearishly below MACDAverage.
Ethereum
Ethereum (ETH/USD) came off early in today’s Asian session as the pair depreciated to the 147.03 area after being capped around the 149.88 area during yesterday’s Asian session. Chartists are closely monitoring market activity to see if traders are able to keep the pair above the 144.77 area, representing the 50% retracement of the 131.80 – 157.73 range and an area that price activity has orbited after peaking around the 157.73 area. Below that level, the 141.71 area is technically significant, representing the 61.8% retracement of the aforementioned range. Another important level is the 141.02 level, representing the low during the pullback on 27 November.
If ETH/USD Bulls are able to resume some of their upside buying activity, the 160.15 and 161.39 areas will be closely monitored as upside price objective targets and there are likely some Stops in place above these levels. Above this area, the 168.91 and 170.53 levels are additional upside price objective targets, followed by the 177.66 and 188.50 areas. If ETH/USD Bears continue to push the market lower with downside selling activity, the 137.92 area is another level that will be closely watched, followed by the 131.80 area where Bids emerged in late November, and then the 127.14 area that represents a downside price extension objective target.
Price activity is nearest the 50-bar MA (4-hourly) at 148.47 and the 50-bar MA (Hourly) at 147.94.
Technical Support is expected around 144.77/ 141.74/ 140.61 with Stops expected below.
Technical Resistance is expected around 152.11/ 155.50/ 162.93 with Stops expected above.
On 4-Hourly chart, SlowK is Bearishly below SlowD while MACD is Bullishly above MACDAverage.
On 60-minute chart, SlowK is Bullishly above SlowD while MACD is Bearishly below MACDAverage.