Bitcoin
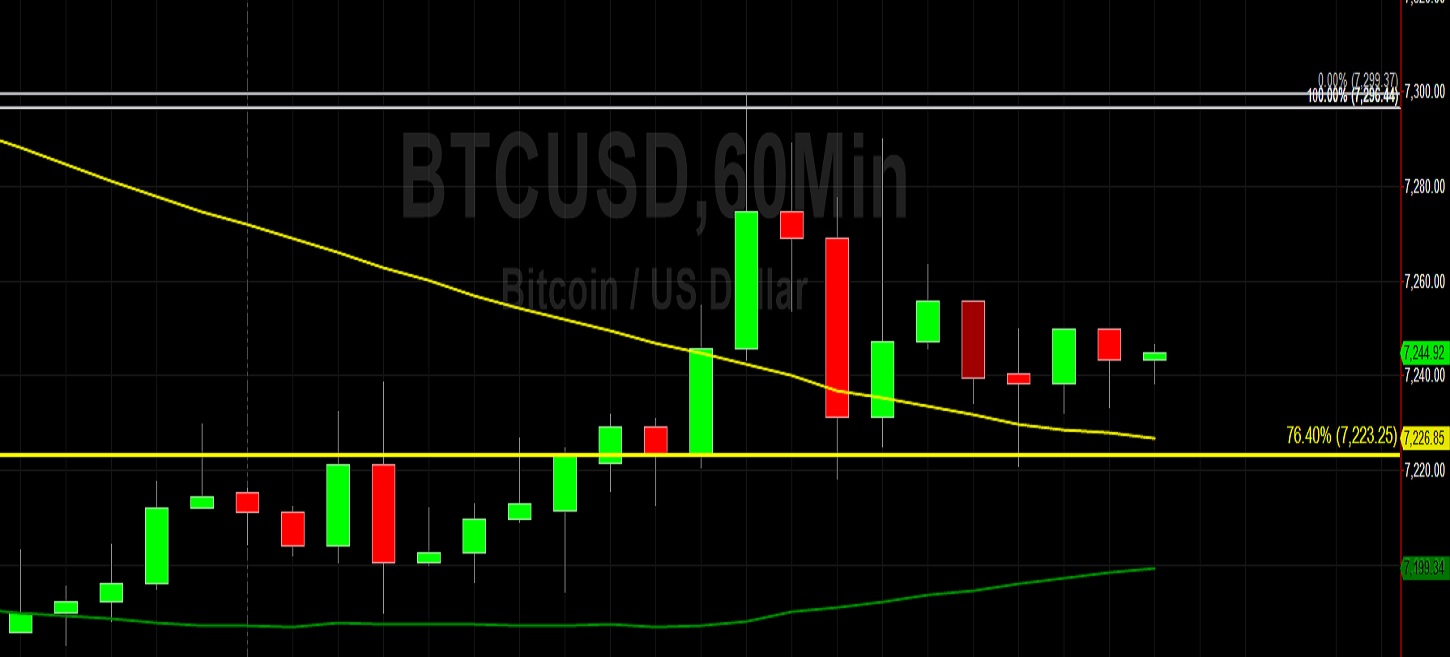
Bitcoin (BTC/USD) weakened early in today’s Asian session as the pair fell to the 7220.95 area after trading as high as the 7299.21 level during in yesterday’s North American session. The pair has steadily appreciated from the 7075.01 area during Thursday’s Asian session before encountering selling pressure yesterday. Chartists note that the 100-bar MA (4-hourly) has recently Bearishly crossed above the 50-bar MA (4-hourly), a technical development that may coincide with some market weakness in the short-term. Likewise, the 200-bar MA (hourly) just Bearishly crossed above the 100-bar MA (hourly), another technical development that may be reflected in additional market weakness, and the 50-bar MA (hourly) is Bearishly converging with the 100-bar MA (hourly).
This recent move higher and subsequent move lower were important because the recent high of 7299.21 was just above the 7296.44 area, a previous important relative low in the range that saw the market eventually climb to the 10540.49 area. This is an example of a previous technical Support level becoming technical Resistance. If price activity continues to depreciate, traders are eyeing technical Support around the 7039.45 and 6843.21 levels. If price activity appreciates, traders are eyeing technical Resistance around the 7356.65 level and then the 7552.89 area.
Price activity is nearest the 50-bar MA (4-hourly) at 7,342.05 and the 100-bar MA (Hourly) at 7,226.83.
Technical Support is expected around 6775.47/ 6653.57/ 6323.42 with Stops expected below.
Technical Resistance is expected around 7870.10/ 8062.04/ 8338.78 with Stops expected above.
On 4-Hourly chart, SlowK is Bearishly below SlowD while MACD is Bullishly above MACDAverage.
On 60-minute chart, SlowK is Bullishly above SlowD while MACD is Bearishly below MACDAverage.
Ethereum
Ethereum (ETH/USD) appreciated early in today’s Asian session as the pair climbed to the 145.03 level after buying pressure emerged around the 142.76 area during yesterday’s European session. The pair has generally been Bid higher from the 139.10 level during Thursday’s Asian session. Market technicians observe that the 100-bar MA (4-hourly) recently Bearishly crossed above the 50-bar MA (4-hourly), a Bearish technical development that may result in additional downside weakness. Similarly, chartists note that the 200-bar MA (hourly) recently Bearishly crossed above the 100-bar MA (hourly), another Bearish technical development that may coincide with additional market weakness.
In contrast, the 50-bar MA (hourly) is Bullishly converging with the 100-bar MA (hourly) and this could lead to some short-term market gains. The pair has recently been capped around the 146.00 figure, a previous relative low that saw the market appreciate to the 364.49 area. Technical Bids recently kept the pair trading above the 137.92 area, a technical Support level that represents the 76.4% retracement of the move from 131.80 to the 157.73 level. Before and after this move lower to the 139.10 area, the market encountered technical Resistance around the 143.96 area, a downside price objective related to the 186.26 level where the market encountered technical Resistance on 17 November. The pair generally continues to orbit the 144.77 area, representing the 50% retracement of the move from 131.80 to 157.73.
Price activity is nearest the 50-bar MA (4-hourly) at 146.44 and the 100-bar MA (Hourly) at 144.62.
Technical Support is expected around 137.92/ 131.80/ 127.14 with Stops expected below.
Technical Resistance is expected around 146.59/ 149.31/ 152.11 with Stops expected above.
On 4-Hourly chart, SlowK is Bullishly above SlowD while MACD is Bullishly above MACDAverage.
On 60-minute chart, SlowK is Bullishly above SlowD while MACD is Bullishly above MACDAverage.