Bitcoin
Bitcoin (BTC/USD) fell sharply early in today’s Asian session as the pair came off to the 7105.00 area after spiking higher to the 7298.50 area late in yesterday’s North American session. Traders have experienced greater volatility in recent trading sessions, rendering it more challenging to make prudent risk management decisions. The pair spiked to the 7659 level earlier this week before it came off, shortly after spiking to the 7643 area before depreciating quickly. A more volatile move was seen last week when BTC/USD quickly appreciated to the 7775 level before receding back below the 7200 area. This volatility evidences upward price movements that are unable to be sustained, one indication that market bias remains difficult to understand.
Chartists continue to monitor some key trading levels, including the 7198, 7356, and 7552 areas. Also, the 7568.81 area represents the 23.6% retracement of the the move from 10944.67 to 6526.00. Above that area, the 7893.48 level is an important one that traders tested on 29 November when the market escalated to the 7870 area, and the 7893 area is technically significant because it represents the 23.6% retracement of the move from 12320.40 to 6526.00. If BTC/USD gains some upside momentum, technicians will focus on the 8101 and 8258 areas, levels that are technically relevant because they relate to earlier recent relative highs. Also, the 8289 area is technically significant as it represents a downward price extension objective related to the late-October high of 10540.49.
Price activity is nearest the 50-bar MA (4-hourly) at 7,350.38 and the 50-bar MA (Hourly) at 7,250.18.
Technical Support is expected around 6775.47/ 6653.57/ 6323.42 with Stops expected below.
Technical Resistance is expected around 7870.10/ 8062.04/ 8338.78 with Stops expected above.
On 4-Hourly chart, SlowK is Bearishly below SlowD while MACD is Bearishly below MACDAverage.
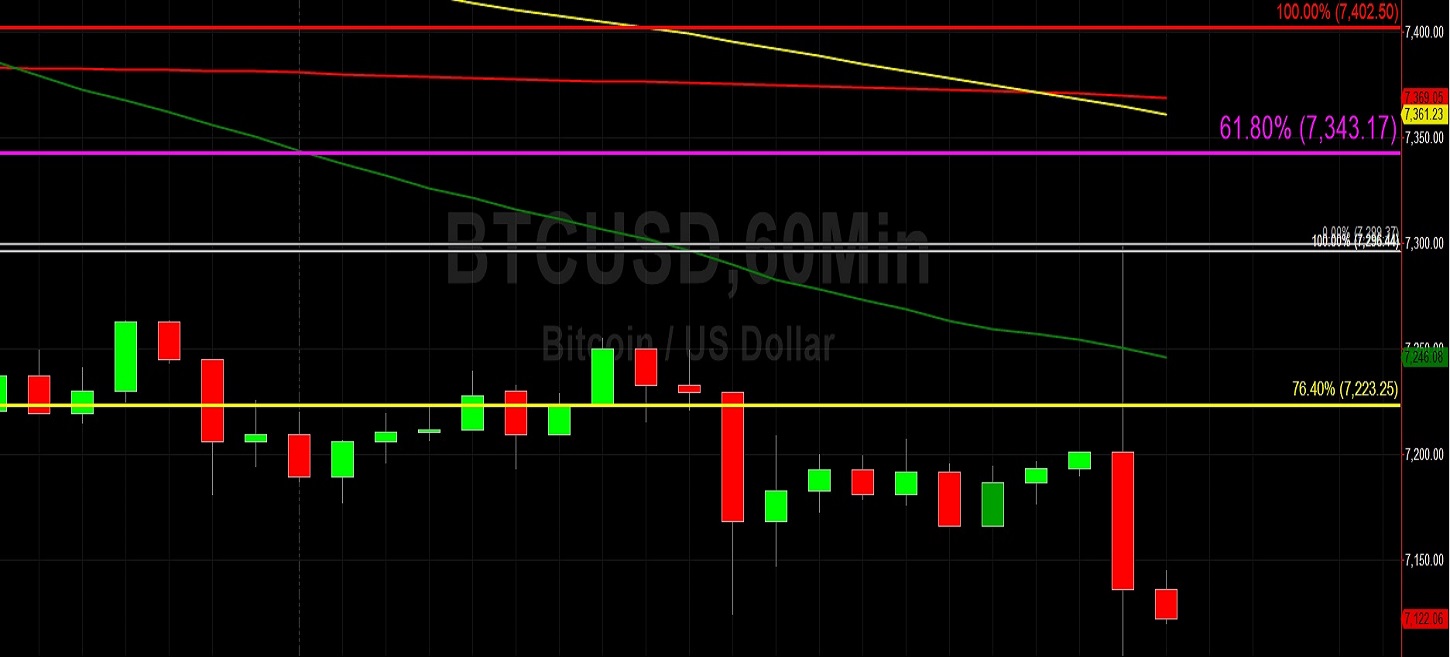
On 60-minute chart, SlowK is Bearishly below SlowD while MACD is Bearishly below MACDAverage.
Ethereum
Ethereum (ETH/USD) weakened early in today’s Asian session as the pair fell to the 141.03 level after trading as high as the 146.29 level during yesterday’s Asian session. The pair came off to the 142.01 level during yesterday’s North American session before spiking higher to the 144.09 area early in today’s North American session. Traders have encountered heightened volatility in recent trading sessions, and this volatility is causing greater uncertainty regarding risk management decisions. Traders pushed the pair to the 151.47 area during Monday’s North American session but the pair quickly depreciated to the 146.29 area, an episode that took place after the pair twice tested the 152.00 figure. Last week, the pair spiked to the 153.00 figure before quickly coming off to the 143.80 area.
The 152.16 area remains a focal point for traders on the upside, and if it is breached it will open up some upside targets including the 155.74 and 157.08 areas. The 155.74 level is technically significant because it represents an upside price objective level that became relevant when the market tested Bids around the 141.02 area on 27 November. The 157.08 area is technically significant because it was a downside price objective related to the market’s test of Offers around the 186.26 area on 17 November. Above those levels, traders anticipate some selling pressure around the 160.15 and 161.39 areas.
Price activity is nearest the 50-bar MA (4-hourly) at 146.94 and the 50-bar MA (Hourly) at 145.24.
Technical Support is expected around 137.92/ 131.80/ 127.14 with Stops expected below.
Technical Resistance is expected around 146.59/ 149.31/ 152.11 with Stops expected above.
On 4-Hourly chart, SlowK is Bearishly below SlowD while MACD is Bearishly below MACDAverage.
On 60-minute chart, SlowK is Bearishly below SlowD while MACD is Bearishly below MACDAverage.