Bitcoin
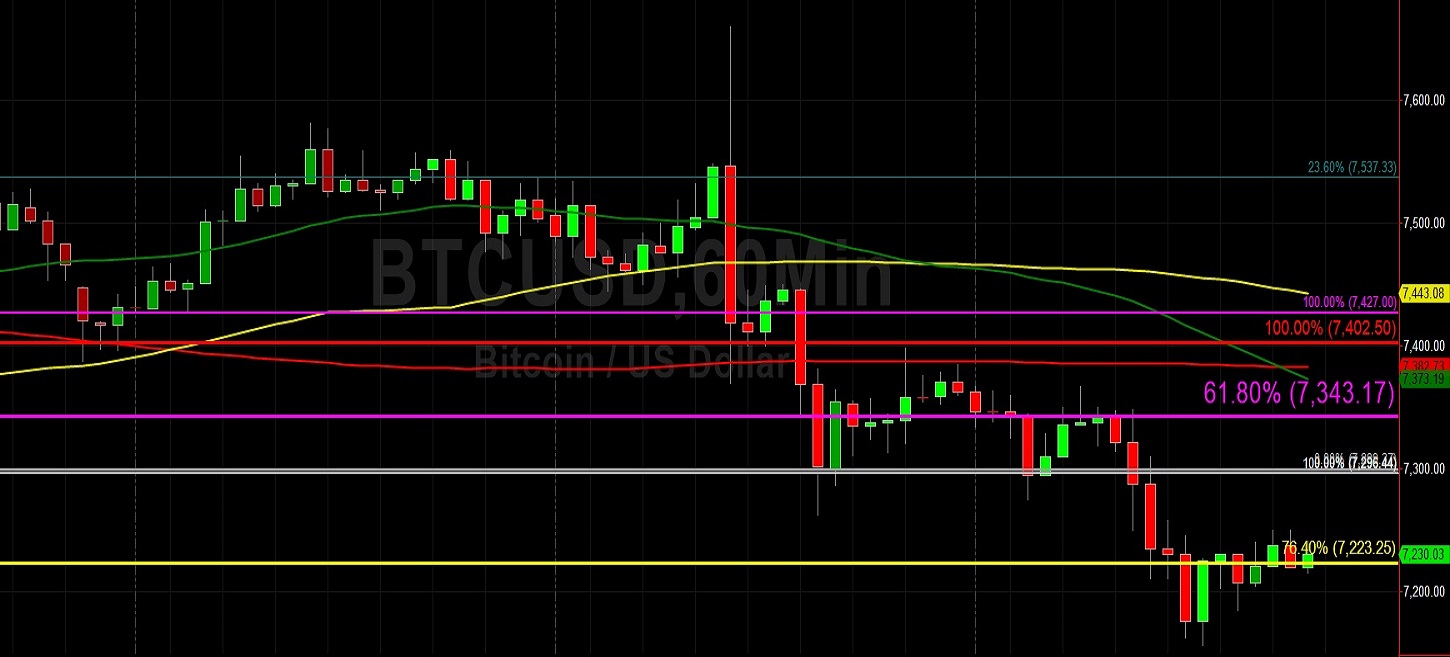
Bitcoin (BTC/USD) appreciated early in today’s Asian session as the pair was lifted to the 7250.00 area after trading as low as the 7156.03 area during yesterday’s North American session. The pair had spiked higher to the 7659.38 area during Monday’s North American session before coming off and trading as high as the 7398.00 area during yesterday’s Asian session. In recent days, the pair has oscillated around some key technical trading levels including the 7552.89 and 7356.65 areas, representing the 23.6% and 38.2% retracements of the recent move from 6526.00 to 7870.10. Another very important level is the 7568.81 area, a level that represents the 23.6% retracement of the move from 10944.67 to 6526.00.
Above that area, the 7893.48 level is an important one that traders tested on 29 November when the market escalated to the 7870 area, and the 7893 area is technically significant because it represents the 23.6% retracement of the move from 12320.40 to 6526.00. Above those areas, chartists are monitoring levels including the 8101 and 8258 areas, other important retracement areas from earlier relative recent highs. Above the 8101 and 8258 areas, traders anticipate that some Stops are likely in place, and if these levels are breached some additional upward price pressure could emerge. Additionally, the 8289 area is technically significant as it represents a downward price extension objective related to the late-October high of 10540.49, as does the 7594 level that the market has recently tested.
Price activity is nearest the 100-bar MA (4-hourly) at 7,358.13 and the 50-bar MA (Hourly) at 7,373.29.
Technical Support is expected around 6775.47/ 6653.57/ 6323.42 with Stops expected below.
Technical Resistance is expected around 7870.10/ 8062.04/ 8338.78 with Stops expected above.
On 4-Hourly chart, SlowK is Bearishly below SlowD while MACD is Bearishly below MACDAverage.
On 60-minute chart, SlowK is Bullishly above SlowD while MACD is Bullishly above MACDAverage.
Ethereum
Ethereum (ETH/USD) gained ground early in today’s Asian session as the pair was lifted to the 145.96 area after finding a floor around the 143.81 area during yesterday’s North American session. The pair has steadily declined following its recent peak around the 152.00 area on Sunday and was capped around the 148.72 area during yesterday’s Asian session. The 152.16 area has emerged as an important price level in recent trading sessions as traders have tested this area. Its technical significance became evident on 20 November when traders tested the 177.25 area before the market extended recent depreciation, triggering a significant amount of Stops below the 171.67 area before additional Stops were hit below the 165.21 area.
The pair’s next downside price objective below the 152.16 area related to the same range is the 140.98 area, a level that was tested on 22 November when the market came off sharply to the 137.80 area. If traders are able to breach the 152.16 area on the upside, it will open up some upside targets including the 155.74 and 157.08 areas. The 155.74 level is technically significant because it represents an upside price objective level that became relevant when the market tested Bids around the 141.02 area on 27 November. The 157.08 area is technically significant because it was a downside price objective related to the market’s test of Offers around the 186.26 area on 17 November. Above those levels, traders anticipate some selling pressure around the 160.15 and 161.39 areas.
Price activity is nearest the 50-bar MA (4-hourly) at 147.60 and the 50-bar MA (Hourly) at 147.66.
Technical Support is expected around 141.74/ 140.61/ 137.92 with Stops expected below.
Technical Resistance is expected around 152.11/ 155.50/ 162.93 with Stops expected above.
On 4-Hourly chart, SlowK is Bullishly above SlowD while MACD is Bearishly below MACDAverage.
On 60-minute chart, SlowK is Bullishly above SlowD while MACD is Bullishly above MACDAverage.