Bitcoin
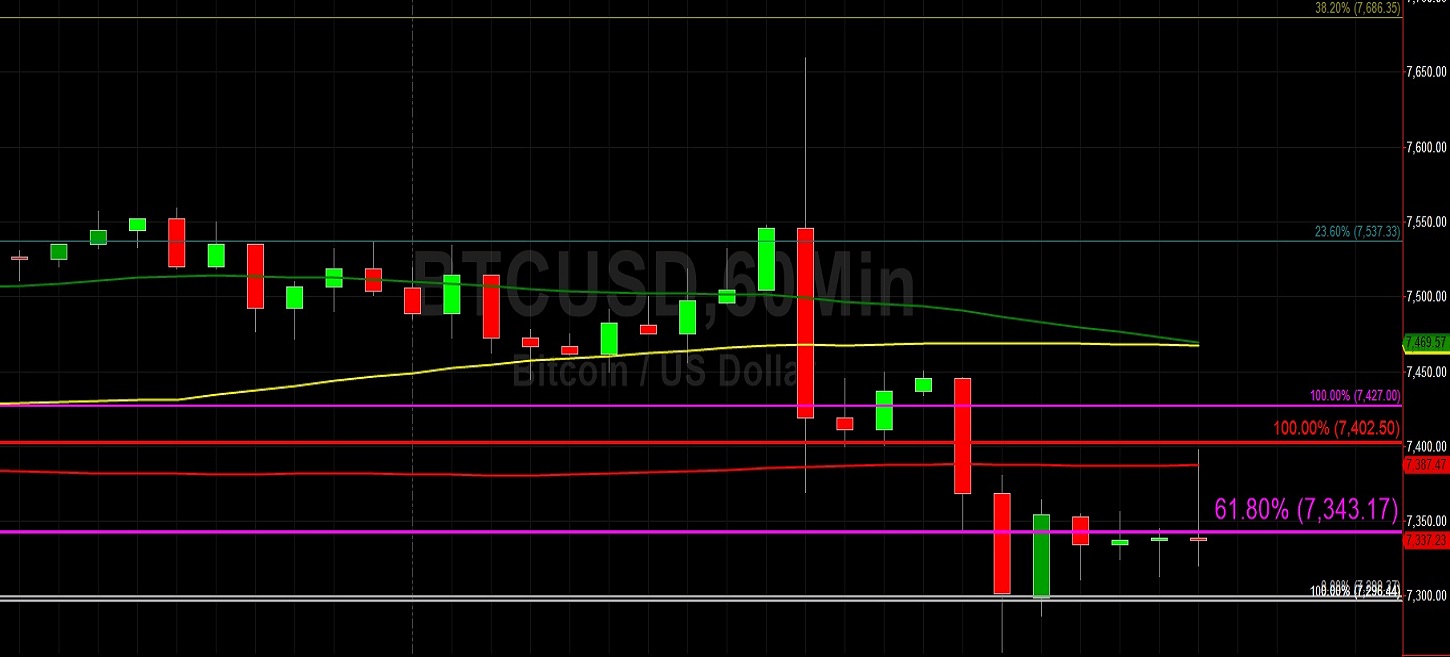
Bitcoin (BTC/USD) gained ground early in today’s Asian session as the the pair was lifted to the 7345.00 level after trading as low as the 7262.87 area during yesterday’s North American session. The pair spiked to the 7659.38 level earlier in yesterday’s North American session and evidenced a lot of volatility. Some traders are increasingly repricing their portfolios to reflect improving market sentiment and at least a slightly stronger upward bias. This has become evident by BTC/USD’s recent gyrations above the 7552.89 level, an area that represents the 23.6% retracement of the 6526.00 – 7870.10 area. One clue that technicians and chartists are monitoring is whether the BTC/USC can remain bid above the 7473.42 area, a level that represents the 23.6% retracement of the 10540.49 – 6526.00 range. Other very important technical retracement levels related to depreciations from recent relative highs including the 7568, 7893, 8101, and 8258 areas.
Stops are likely in place above those levels, especially given their technical significance as a result of the market’s depreciations. In addition to these technical retracement levels, traders are focusing on upside price objectives that include the 7884.76, 8304.27, 8723.78, and 9242.83 areas. Selling pressure could be in place ahead of these levels, and Stops could be elected above these levels if traders are able to push through these areas. Moreover, one additional upside target that traders may challenge is the 8289.82 level, an area that represented a downside price objective target related to the 10540.49 relative high from late October. Its relevance was confirmed after many Stops were triggered below that area on 18 November.
Price activity is nearest the 100-bar MA (4-hourly) at 7,357.54 and the 200-bar MA (Hourly) at 7,387.55.
Technical Support is expected around 6775.47/ 6653.57/ 6323.42 with Stops expected below.
Technical Resistance is expected around 7870.10/ 8062.04/ 8338.78 with Stops expected above.
On 4-Hourly chart, SlowK is Bullishly above SlowD while MACD is Bearishly below MACDAverage.
On 60-minute chart, SlowK is Bullishly above SlowD while MACD is Bearishly below MACDAverage.
Ethereum
Ethereum (ETH/USD) appreciated early in today’s Asian session as the pair escalated to the 148.22 level after spiking to the 151.47 area during yesterday’s North American session. Volatility was elevated after the pair was unable to move above the 151.61 area during yesterday’s North American session. The pair’s recent upward movements have led to an improving market bias among traders that has resulted in a growing accumulation of long positions at or above key levels that include the 144.77 and 146.59 areas. Both of these levels are upside price objectives related to the recent 131.80 relative low. Another important level being monitored by traders is the 147.78 area, a level that ETH/USD has recently orbited and remains very technically significant as it represents the 23.6% retracement of the 199.50 – 131.80 range.
Above this area, the next upside price objective target related to this range is the 157.66 area, a level that represents the 38.2% retracement of the same range. Furthermore, additional levels being scrutinised by traders include the 153.36, 157.21, and 175.88 areas, all of which are 23.6% retracement levels related to relative highs including the 224.34, 239.45, and 318.60 levels. Stops are likely in place above the 160.15 and 161.39 areas, both of which are upside price objectives related to the recent 131.80 low. Likewise, the 168.91 and 170.53 areas are additional upside targets. Closer to recent price activity, selling pressure is likely ahead of the 152.16 and 156.99 areas with additional selling pressure likely below the 163.35 and 165.11 levels.
Price activity is nearest the 50-bar MA (4-hourly) at 147.93 and the 200-bar MA (Hourly) at 148.09.
Technical Support is expected around 144.77/ 141.74/ 140.61 with Stops expected below.
Technical Resistance is expected around 152.11/ 155.50/ 162.93 with Stops expected above.
On 4-Hourly chart, SlowK is Bearishly below SlowD while MACD is Bearishly below MACDAverage.
On 60-minute chart, SlowK is Bullishly above SlowD while MACD is Bearishly below MACDAverage.