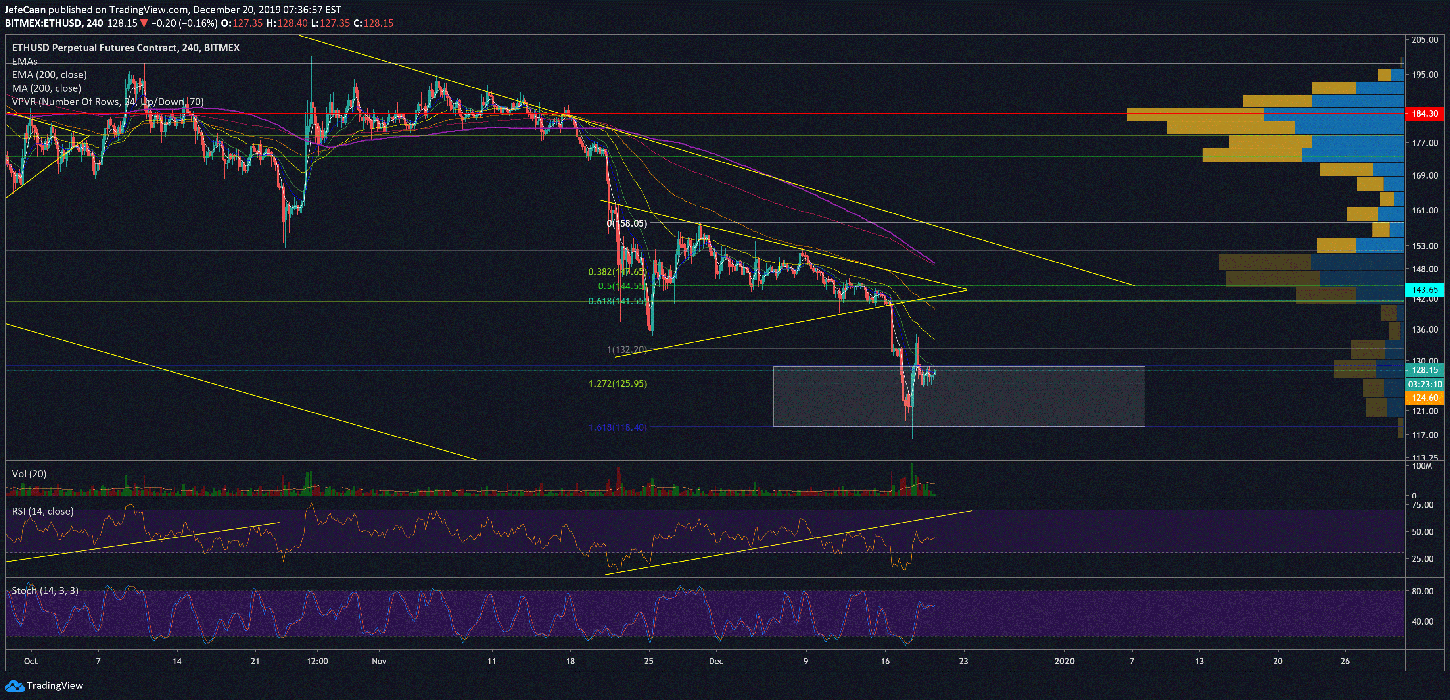
Ethereum (ETH) bulls are beginning to lose hope. The price has been trading between $128 and $124 for a while which has disheartened retail bulls and for good reason. Every time we see the price decline, when it is followed by a quick bounce to the upside and a steady uptrend, there is hope. However, if it keeps going sideways, then it increases the probability of another decline. RSI for ETH/USD on the 4H time frame shows that there may be some room for limited upside. However, that is nothing much to be excited about because it would be just another opportunity to sell and short sell. The 4H chart shows the systemic manner in which the price has been declining while the bulls have been waiting for a reversal all along.

The reason retail bulls are losing hope is that the price is now very close to where it was in December of last year. In other words, this year has been inconsequential for hodlers. In fact, those that bought near the top might have ended up losing despite the numerous bullish opportunities. In my opinion, most retail traders overcomplicate things with fancy indicators and shortcuts. There is no shortcut to consistently being successful. You have to put in the time and see what works and what does not. Even if you are not a good trader, it is very important that you realize your capabilities and your limitations when it comes to trading. Signs of an uptrend like higher highs and higher lows or of a downtrend like lower highs and lower lows are so straightforward, but most traders fail to capitalize on it because of the wrong expectations.
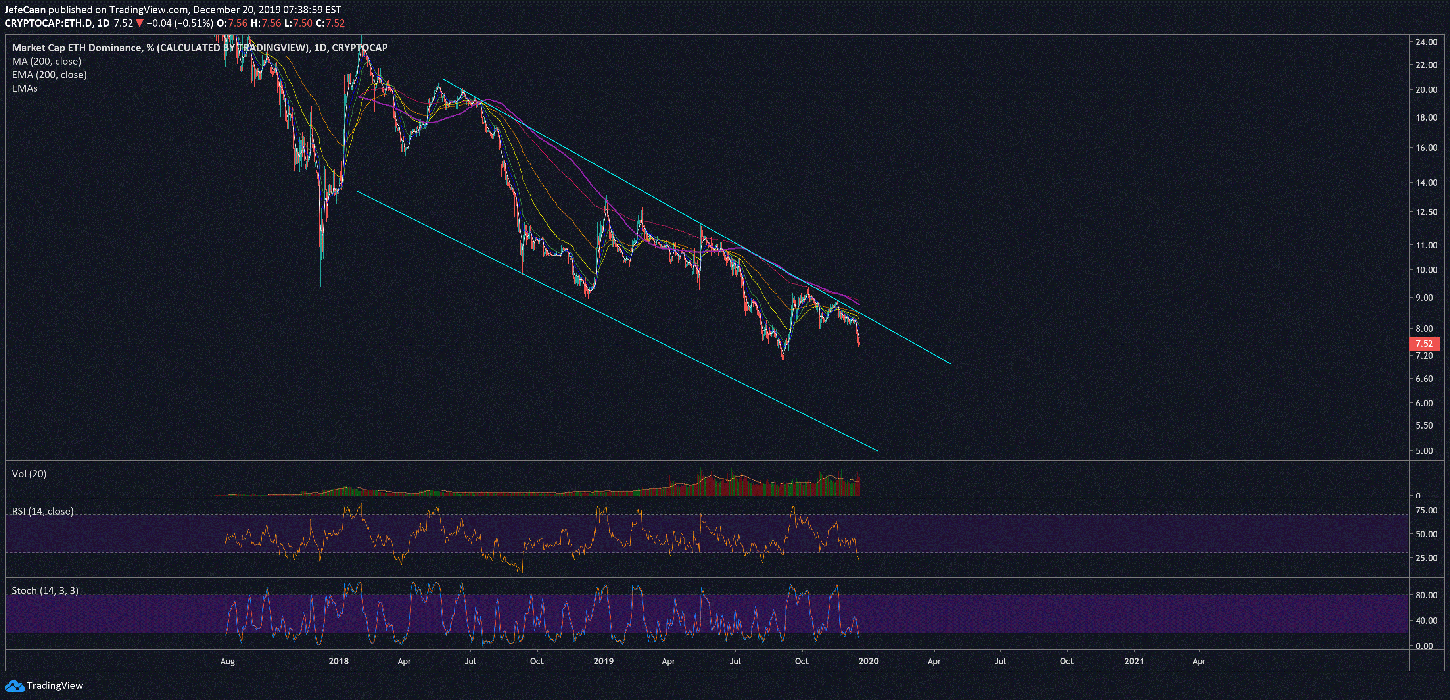
For instance, if we look at the daily chart for Ethereum Dominance (ETH.D) we can see very clearly that it has been printing lower highs and lower lows within the descending channel. It is easy to get confused by short-term noise but as responsible traders we should be able to discern the big picture from the short-lived noise. Another important thing to note here is the decline below the 200-day moving average.
Soon as we saw a decline below that line (shown in purple), you can see the market crashed hard. That crash did not happen overnight. In fact, you can see that it took many days of constant trading below the 200-day moving average. That might have been a very good time to get out of the market and it would have been so simple as well. Unfortunately, most traders hope and pray rather than trade what is in front of them. They keep hoping the price will moon when is just beginning to crash. I hope retail traders can still benefit from this because as we can see on the daily chart, Ethereum dominance (ETH.D) might crash hard once again to the bottom of the descending channel in the days and weeks ahead.