Sally Ho's Technical Analysis 20 December 2019
Bitcoin
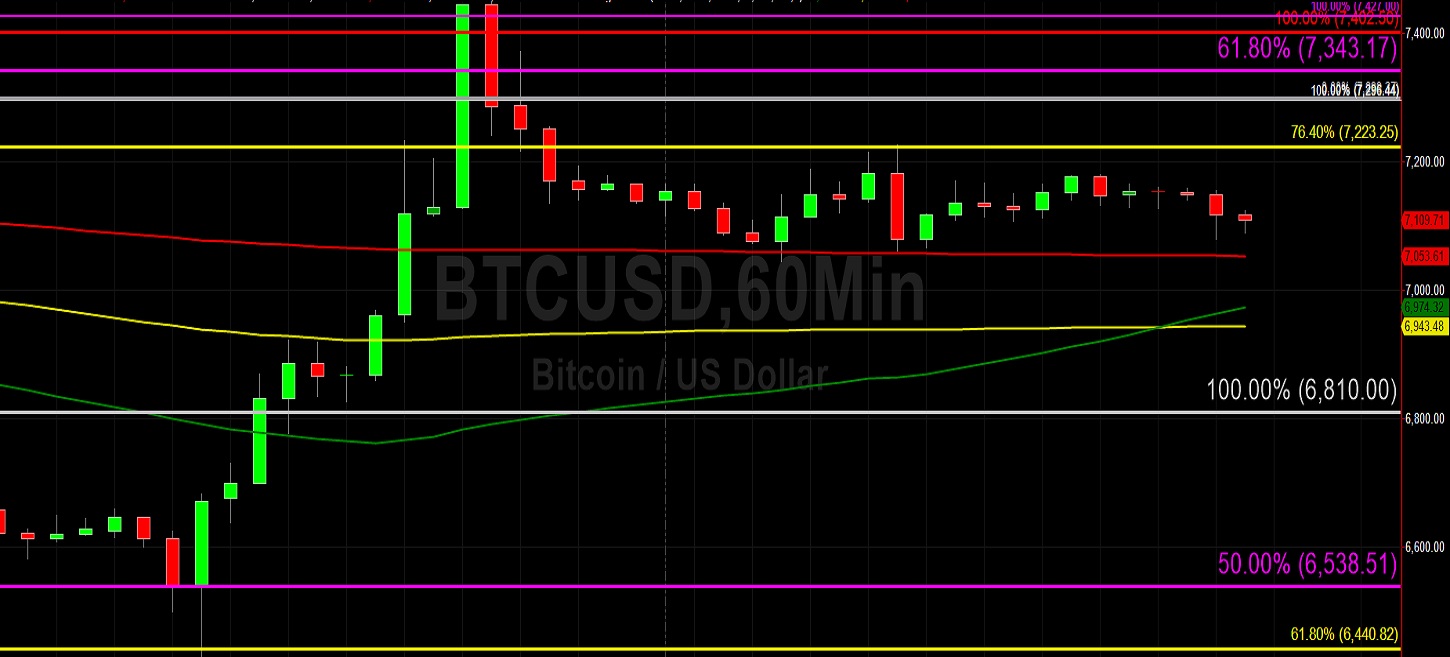
Bitcoin (BTC/USD) depreciated early in today’s Asian session as the pair fell to the 7080.00 level following its inability to move above the 7227.48 area during yesterday’s European session. Following the pair’s mid-week move back above the 7000 figure, traders have tested Bids around the 50-bar MA (4-hourly) and the 200-bar MA (hourly). These indicators will be critical tests as traders evaluate whether BTC/USD Bulls have the resolve to keep the pair Bid above these areas. Chartists also observed that after BTC/USD peaked around the 7445.00 level earlier this week and retraced lower, it has been capped around the 7223.25 area, a level that represents the 76.4% retracement of the 8488.00 – 3128.89 range.
This cap on the market’s activity was also right around the 100-bar MA (4-hourly), and notably this week’s high around the 7445.00 level was also right around the 200-bar MA (4-hourly), further indication that BTC/USD is taking its cues from technicals. Above current market activity, traders are looking at potential technical Resistance around the 7365, 7580, and 7722 areas. Below current market activity, traders continue to look at levels including the 6857, 6653, and 6526 areas. Additionally, significant buying activity commenced mid-week around the 6430 area.
Price activity is nearest the 50-bar MA (4-hourly) at 7,050.24 and the 200-bar MA (Hourly) at 7,053.54.
Technical Support is expected around 6526.00/ 6323.42/ 5941.26 with Stops expected below.
Technical Resistance is expected around 7568.81/ 7870.10/ 8338.78 with Stops expected above.
On 4-Hourly chart, SlowK is Bearishly below SlowD while MACD is Bullishly above MACDAverage.
On 60-minute chart, SlowK is Bearishly below SlowD while MACD is Bearishly below MACDAverage.
Ethereum
Ethereum (ETH/USD) was relatively steady early in today’s Asian session as the pair traded as low as the 125.93 area. The pair traded as high as the 134.81 level mid-week following its steady move higher from the 116.25 area, but has since settled lower. Traders are waiting to see how the pair trades around the 122.75 area, a level that was a relative historic low prior to a longer-term appreciation to the 364.49 area. Notably, the pair has been orbiting the 50-bar MA (hourly) following its retracement from weekly highs. Technicians are also waiting to see if the pair can remain above the 125.16 area, representing the 61.8% retracement of the move from 100.15 to 165.62.
Traders were unable to take ETH/USD too far above the 100-bar MA (hourly) during the steady move higher this week. Coupled with the multi-session Support around the 50-bar MA (hourly), it is apparent that technicals are having a major impact on risk management at present. Traders are also particularly interested in the market’s gyrations around the 127.14 area, a downside price objective that it pierced mid-week and below which sizable Stops were elected. If the market is able to find some buying pressure above this area, traders will see if the pair can sustain a move above the 131.80 level.
Price activity is nearest the 50-bar MA (4-hourly) at 136.33 and the 50-bar MA (Hourly) at 126.49.
Technical Support is expected around 119.50/ 115.60/ 111.17 with Stops expected below.
Technical Resistance is expected around 137.61/ 141.74/ 146.00 with Stops expected above.
On 4-Hourly chart, SlowK is Bullishly above SlowD while MACD is Bullishly above MACDAverage.
On 60-minute chart, SlowK is Bullishly above SlowD while MACD is Bullishly above MACDAverage.
