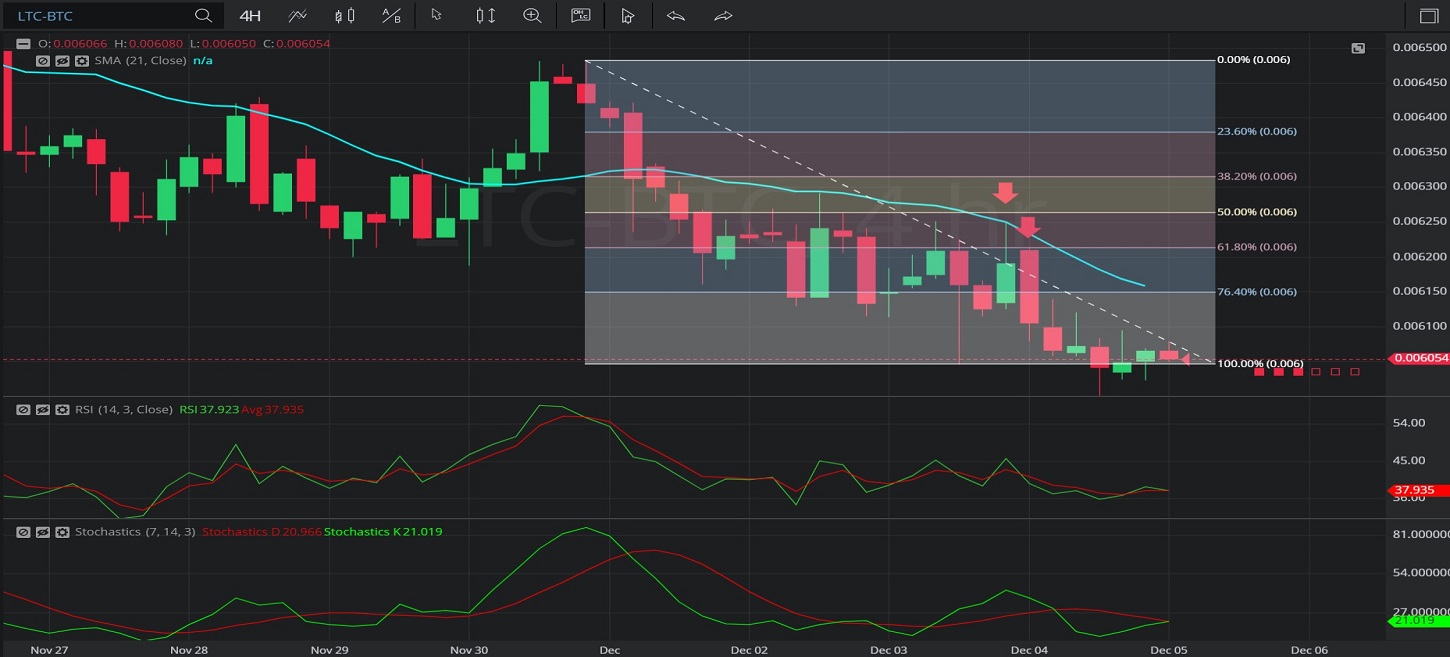
In this 4-hourly chart of Litecoin/ Bitcoin (LTC/ BTC), there is a depreciating range from 0.006482 to 0.006046.
We can see that after the depreciation, the market appreciated to the 0.006251 level (identified by the first red down arrow), right around the 21-bar Simple Moving Average.
We can see the market then appreciated to the 0.006213 level (identified by the second red down arrow), right around the 0.006212552 level that represents the 38.2% retracement of the depreciating range.
We can see the market then extended its depreciation.
Using RSI, we can observe RSI Average (3) bearishly crossed above RSI (14) after the market traded around the 0.006213 level. We can also thereafter see negative slopes on both RSI Average (3) and RSI (14), indicating additional market weakness was likely.
Using Slow Stochastics, we can see the slope of Stochastics K turned negative after the market traded around the 0.006213 level, and that Stochastics D bearishly crossed above Stochastics K during the market’s subsequent depreciation. We can see a positive slope returned to Stochastics K, possibly signifying less selling pressure.
Stay on top of the cryptocurrency market with CryptoDaily’s trading charts!