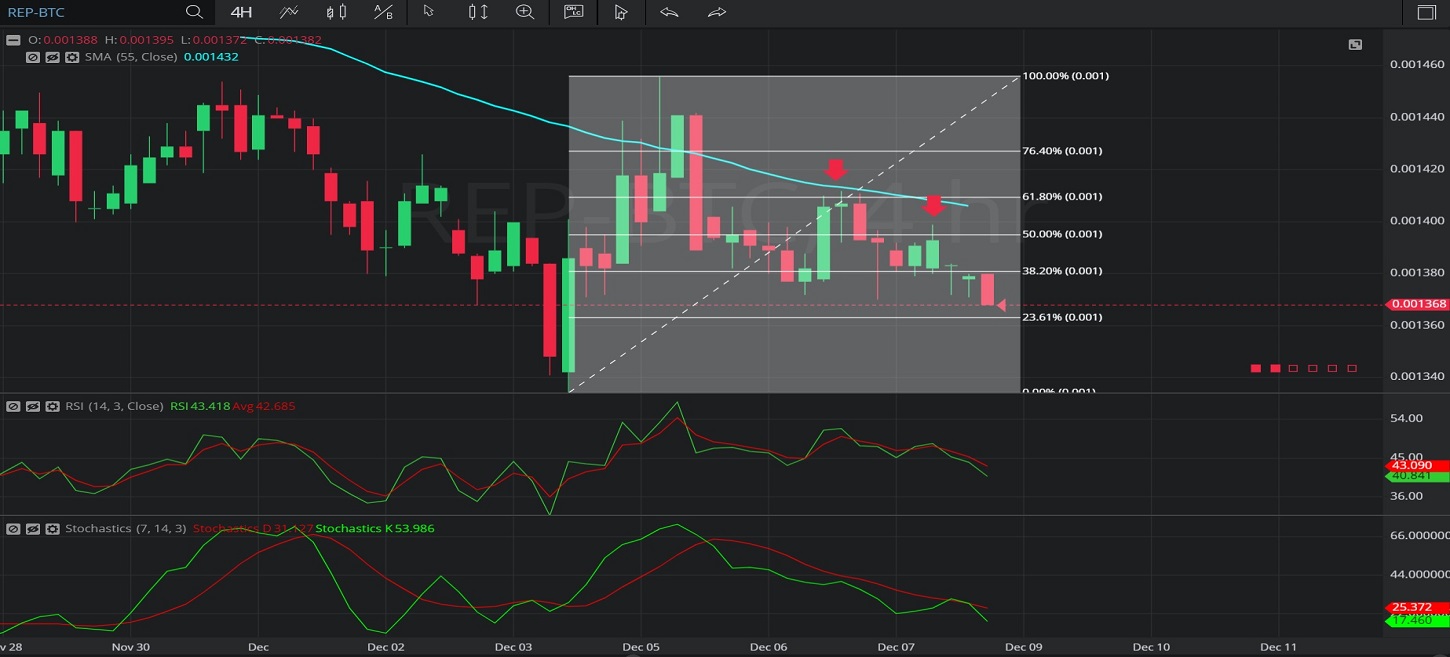
In this 4-hourly chart of Augur/ Bitcoin (REP/ BTC), there is an appreciating range from 0.001334 to 0.001456.
We can see that after the market depreciated to the 0.001372 level, the market again appreciated and traded as high as 0.001412 level (identified by the first red down arrow), just below the 55-bar Simple Moving Average.
This high was also just above the 0.001409 level, representing the 38.2% retracement of the appreciating range.
After depreciating again, the market traded as high as the 0.001399 level (identified by the second red down arrow), just above the 0.001395 level that represents the 50% retracement of the appreciating range.
The market then depreciated further and continues to depreciate.
Using RSI, we can observe the slopes of both RSI (14) and RSI Average (3) were negative after the market traded as high as the 0.001399 level, and that RSI Average (3) bearishly crossed above RSI (14).
Using Slow Stochastics, we can see the slope of Stochastics D remains negative, and the market continues to depreciate.
Stay on top of the cryptocurrency market with CryptoDaily’s trading charts!