Published
3 years ago on
January 13, 2021
Bitcoin (BTC/USD) weakened early in today’s North American session as the pair depreciated to the 34010.00 area after trading as high as the 35233.27 level during the European session. Traders knocked BTC/USD as low as the 32309.04 level during the Asian session, a test of the 32584.72 level that represents the 61.8% retracement of the recent appreciating range from 30100 to 33604.51. Likewise, the 32779.10 area represents the 23.6% retracement of the recent depreciating range from 41452.12 to 30100.00. Following the pair’s recent new lifetime high around the 41986.37 area, selling pressure intensified around the 41452.12 and 40164.67 areas. Stops were elected below a variety of downside retracement levels during the recent acute pullback, including the 38159.91, 37249.25, 36226.47, 35900.79, 35784.73, 35454.75, 32988.07, 32663.14, 32135.98, 31948.12, and 31414.00 levels. Following this ongoing depreciation, additional areas of potential technical support include the 29783.19, 29093.19, 28847.31, 28148.19, and 27421.33 levels.
During the recent move higher, Stops were recently elected above a series of additional upside price objectives, including the 40517.80, 40667.76, 40991.44, 41200, 41267.10, and 41489.74 levels. Stops were recently elected above the 35943.73, 36480.83, and 36854.45 areas as well, upside price objectives related to previous buying pressure around the 17580, 16200, and 9819.83 levels and the sell-off intensified below these areas during the recent depreciation. If BTC/USD is able to extend recent gains to the upside, additional upside price objectives include the 42309.01, 42701.91, 42803.53, 43447.48, and 43617.07 levels. Traders are observing that the 50-bar MA (4-hourly) is bullishly indicating above the 100-bar MA (4-hourly) and above the 200-bar MA (4-hourly). Also, the 50-bar MA (hourly) is bearishly indicating below the 100-bar MA (hourly) and below the 200-bar MA (hourly).
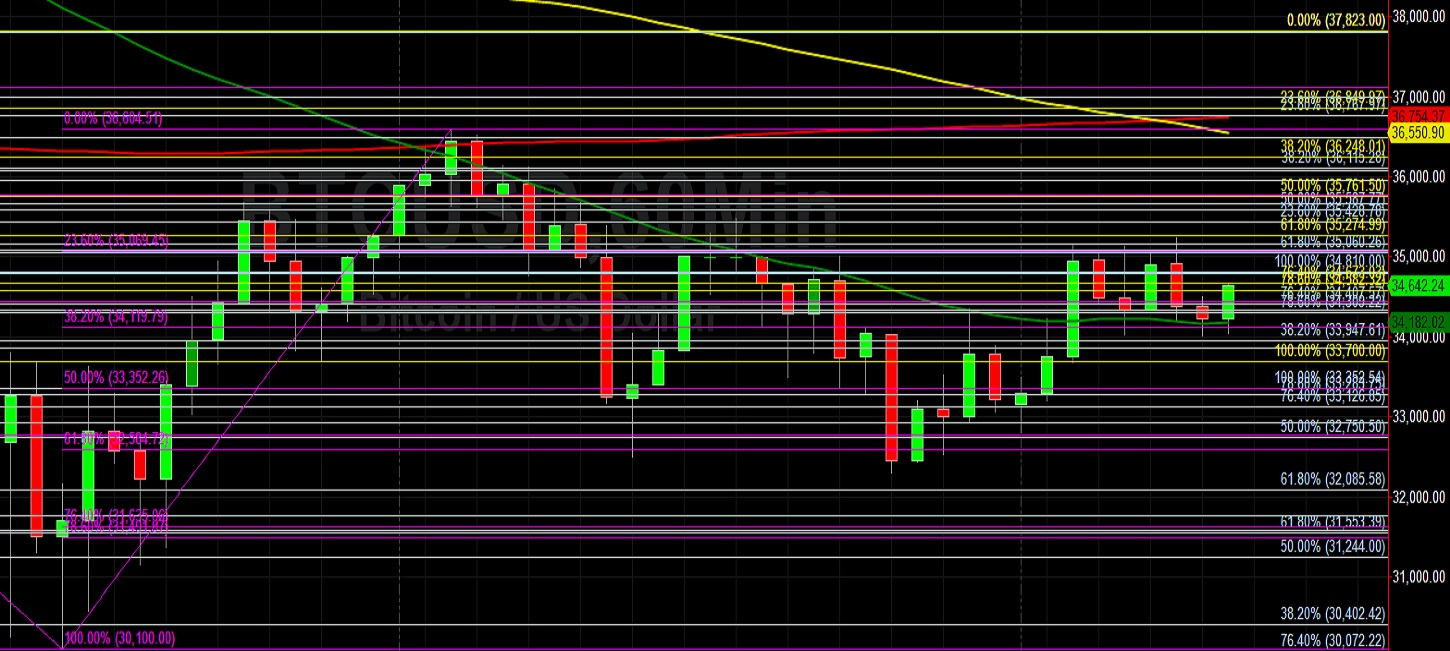
Price activity is nearest the 100-bar MA (4-hourly) at 33243.91 and the 50-bar MA (Hourly) at 34180.01.
Technical Support is expected around 29783.19/ 29093.19/ 28847.31 with Stops expected below.
Technical Resistance is expected around 42309.01/ 42701.91/ 42803.53 with Stops expected above.
On 4-Hourly chart, SlowK is Bullishly above SlowD while MACD is Bearishly below MACDAverage.
On 60-minute chart, SlowK is Bearishly below SlowD while MACD is Bullishly above MACDAverage.
Disclaimer: This trading analysis is provided by a third party, and for informational purposes only. It does not reflect the views of Crypto Daily, nor is it intended to be used as legal, tax, investment, or financial advice.
Investment DisclaimerDexalot Brings Its CEX-Like DEX Trading Platform To Ethereum L2 Arbitrum
Foundation: A New Trading Paradigm