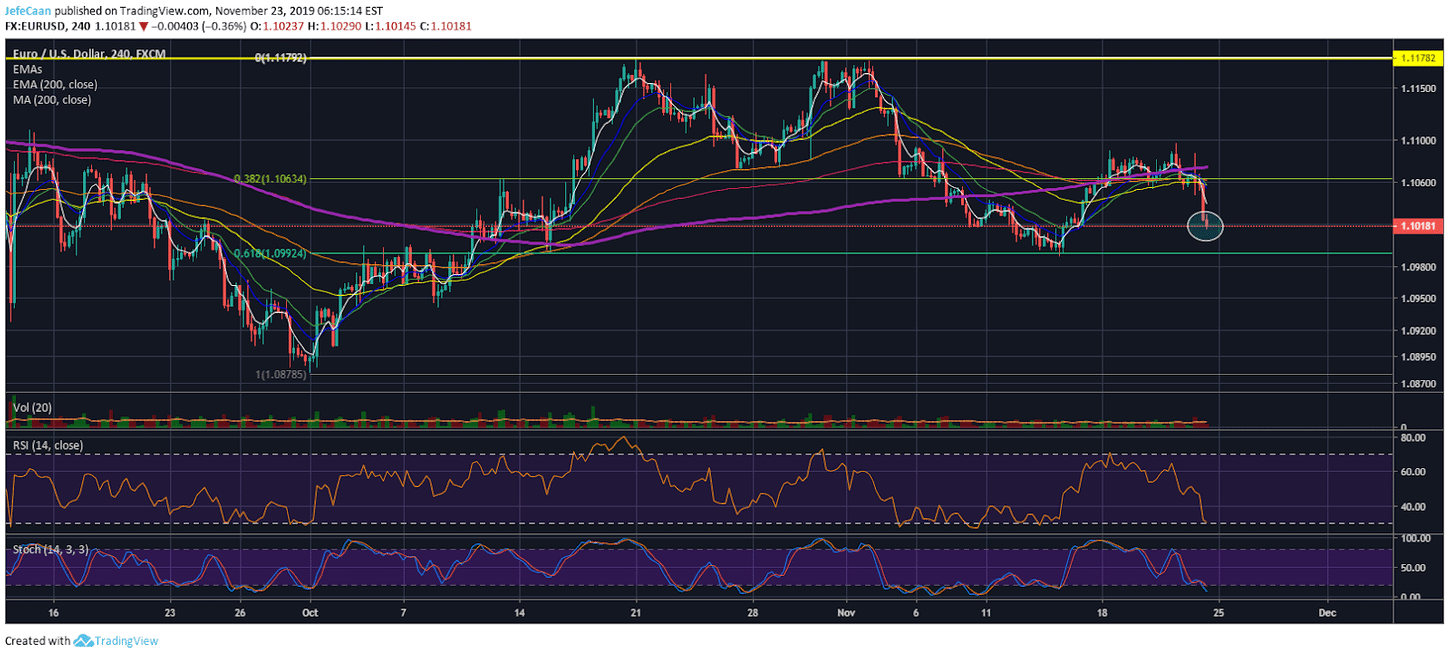
Bitcoin (BTC) has had a brutal decline but just because things are bad does not mean they couldn’t get worse especially if there are some strong indicators that suggest that. If we look at the 4H chart for EUR/USD, we can see that the forex pair ended up closing well below the 38.2% fib extension level. A crash in this pair is what accelerated the crash in Bitcoin (BTC). We have been discussing for the past few months how this pair has been an effective leading indicator for BTC/USD. This time, there is little left to speculation as the pair has already begun a downtrend towards the 61.8% fib extension level which means that Bitcoin (BTC) could fall a lot more before we see a temporary bullish reversal.

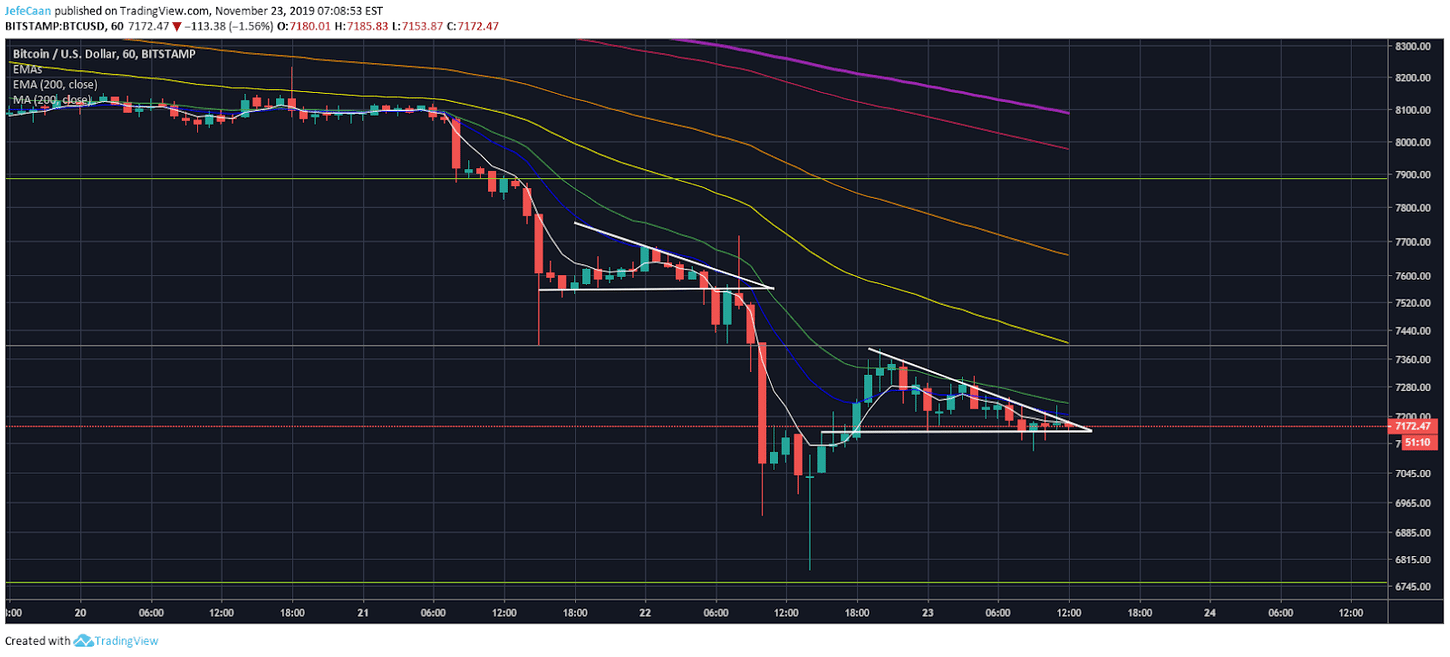
The past 48 hours have seen BTC/USD crash massively tearing below key support levels. However, it is not over yet. We need to see how the weekly candle closes and we need to see how the monthly candle closes. For a short term bullish reversal, we would need to see the price close above the 21 month exponential moving average. If the price closes above the 100 week moving average then that would be even more bullish short term. In that case, we could expect a rally towards $7,894 and even towards $8,421 in the near future. In a more bullish scenario we could also see a rally towards $9,000 although the odds of that happening have diminished significantly. High volatility is expected over the weekend as the bulls would fight for a close above the 100 week exponential moving average.
It is worth mentioning that when Bitcoin (BTC) was in a similar position last November, it ended up declining below the 100 week exponential moving average. We have yet to see if this time will be different for BTC/USD. If the price defends the 100 Week EMA this week, we could expect a relief rally starting next week but even then the EUR/USD forex pair would continue to serve as a leading indicator signaling inevitable further downside if we see the pair decline down to the 61.8% fib extension level and potentially lower than that.
Bitcoin (BTC) is expected to decline towards the 200 week moving average to say the least. If we are being bearish then we would expect it to decline below $3,000 and find a bottom between $1,200 and $3,000. At this point, most traders are convinced that a decline down to $6,000 is inevitable. Traders are however divided on when they think that could happen. As most traders are expecting a short term relief rally here after a brutal decline, we might see an unexpected move to the downside that could shake out a lot of the bulls that have bought the dips here and liquidate more longs. The probability of that happening has increased after yesterday’s bearish close which is why it would not be surprising if Bitcoin (BTC) declines further from here without seeing any temporary bullish reversal.