Bitcoin
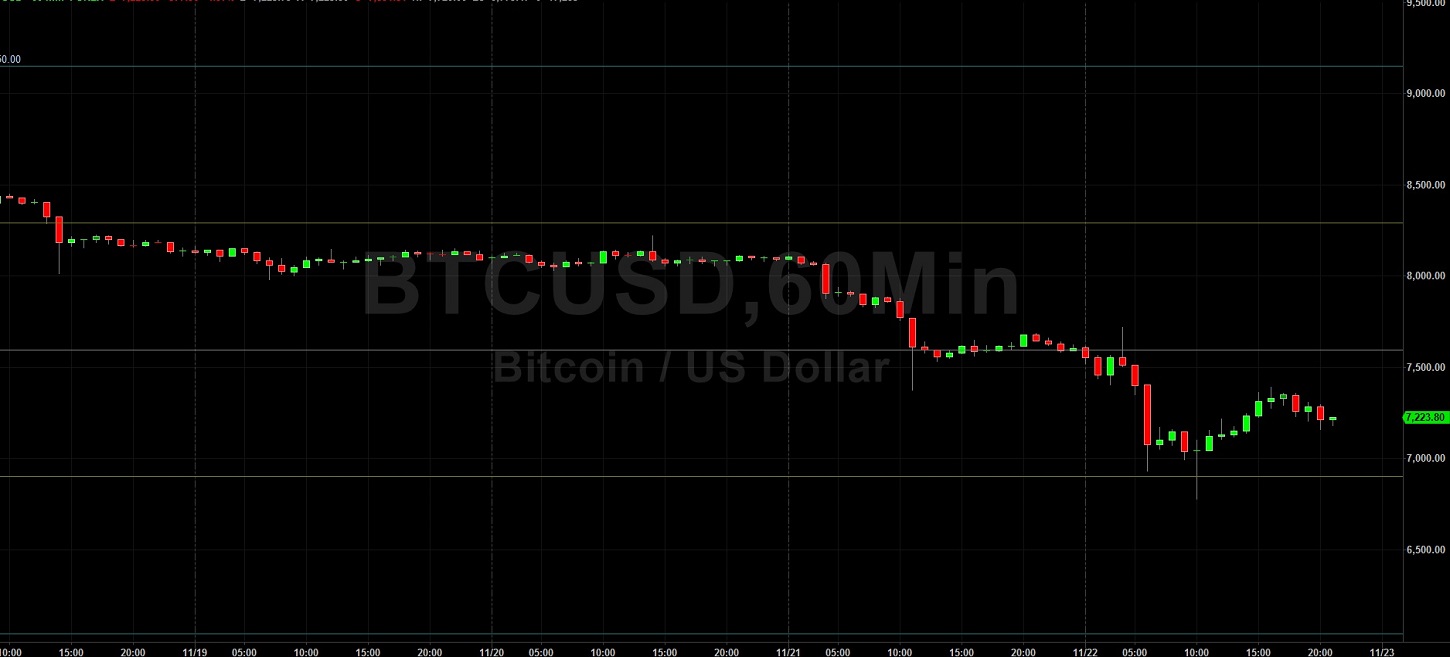
Bitcoin (BTC/USD) faded lower early in today’s Asian session as the pair briefly recovered to the 7392.11 level after trading as low as the 6775.47 area during yesterday’s North American session. The Stops that were elected below the 8289 and 7594 areas earlier this week opened up the 6899 area as an important technical level, and Stops were triggered below this area during yesterday’s trading activity, driving the pair to its lowest level since May. Thursday’s move lower was somewhat abrupt as the 8062.04 area that had been technical Support gave way and that led to Stops being elected below the 7927 and 7806 levels before a larger series of Stops were triggered below the 7712 and 7537 areas. Significant Stops were then reached below the 7427 area as the market crumbled to November monthly lows. The pair has steadily depreciated over the past several weeks following its print around the 10540.49 area in late October, and traders have responded by adopting an increasingly bearish market bias.
Many traders were focusing on the 7296.44 area as a potential area of technical Support given the buying pressure that emerged there on 23 October. Below that area, the 7084.98 level is an extremely important one as it represents the 23.6% retracement of the move from 19891.99 to 7074.98, and large Stops were in place below it. The breach of that level has traders focusing on the 6841.36 area, representing the 76.4% retracement of the move from 4670.69 to 13868.44. Traders have identified new areas of potential technical Resistance following the recent move to multi-week lows and these areas include 8121, 8583, and 8957.
Price activity is nearest the 50-bar MA (4-hourly) at 8,137.94 and the 50-bar MA (Hourly) at 7,575.16.
Technical Support is expected around 6841.36/ 6538.51/ 5941.26 with Stops expected below.
Technical Resistance is expected around 7712.45/ 7927.93/ 8062.04 with Stops expected above.
On 4-Hourly chart, SlowK is Bullishly above SlowD while MACD is Bearishly below MACDAverage.
On 60-minute chart, SlowK is Bullishly above SlowD while MACD is Bullishly above MACDAverage.
Ethereum
Ethereum (ETH/USD) was lower early in today’s Asian session following a move to the 137.80 area during yesterday’s North American session. Stops were elected below the 147.60 area during yesterday’s North American session, representing the 76.4% retracement of the 80.60 – 364.49 range. Market sentiment surrounding the pair has dramatically worsened in recent days after traders were unable to keep the pair trading above some key levels. These areas included the 172.72 level, representing the 23.6% retracement of the move from 239.45 to 152.11, and the 165.25 area, representing the 38.2% retracement of the 302.20 – 80.60 range.
The pair’s move to the 155.00 figure late this week drove the pair to November monthly lows just above recent technical Support around the 153.00 and 152.11 levels prior to yesterday’s collapse. Below these levels, traders are focusing on some very important levels including the 132.90 area that represents the 23.6% retracement of the 302.20 to 80.60 range. The lingering weakness and worsening bias in ETH/USD have traders looking at new areas of potential technical Resistance. The 152.36, 161.37, and 168.65 areas represent the 38.2%, 50%, and 61.8% retracements of the 199.50 – 137.80 range.
Price activity is nearest the 50-bar MA (4-hourly) at 174.22 and the 50-bar MA (Hourly) at 159.89.
Technical Support is expected around 153.00/ 147.60/ 132.90 with Stops expected below.
Technical Resistance is expected around 132.90/ 122.75/ 115.50 with Stops expected above.
On 4-Hourly chart, SlowK is Bullishly above SlowD while MACD is Bearishly below MACDAverage.
On 60-minute chart, SlowK is Bullishly above SlowD while MACD is Bullishly above MACDAverage.