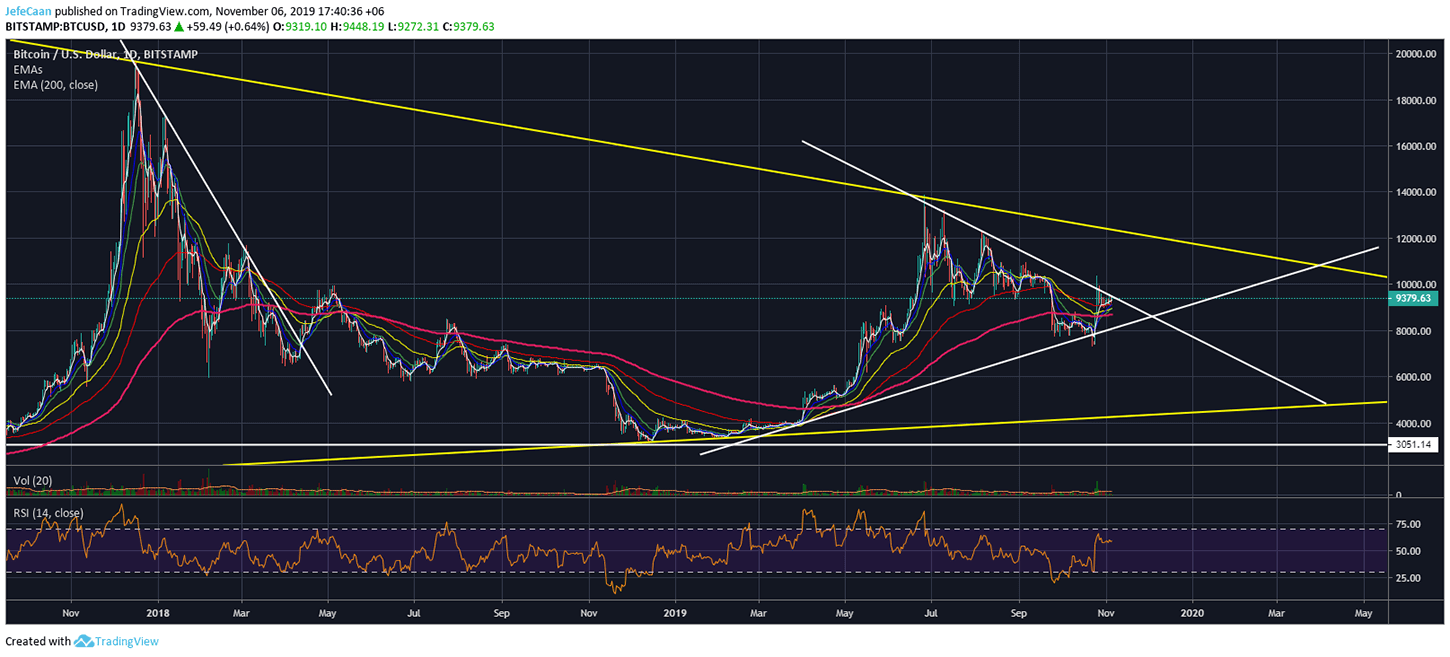
Bitcoin (BTC) is not in an uptrend; it remains in a downtrend on the big picture. The mistake that most new traders often make is to confuse time frames. The price might be bullish on a smaller time frame like the 15 min chart but that does not mean it is bullish on a higher time frame like the 1D chart. As we can see on the daily chart for BTC/USD, the downtrend remains intact and this short term bullishness is likely to come to an end now. One thing that is very important to note that even those that are bullish on Bitcoin (BTC) and don’t expect it to decline below $3,000 would want a retest of the bottom of the symmetrical triangle on this chart before expecting further upside.
Expecting the price to break the trend line resistance at this point means the price would be rallying to the test to the top of the symmetrical triangle again. If you are more bullish than that, you would be expecting it to break out of the symmetrical triangle to rally towards a new high or a new all-time high. However, if we are being reasonable, is this really likely? Trading is about trading what is and looking at the future analyzing probabilities. The odds of the price breaking past these two strong resistance levels are very low compared to it declining towards the bottom of the symmetrical triangle. The Longs/Shorts ratio remains near its all-time high and if the price were to break to the upside to begin another uptrend from this point forward, that would mean that a lot of overly optimistic traders walk away with free money.

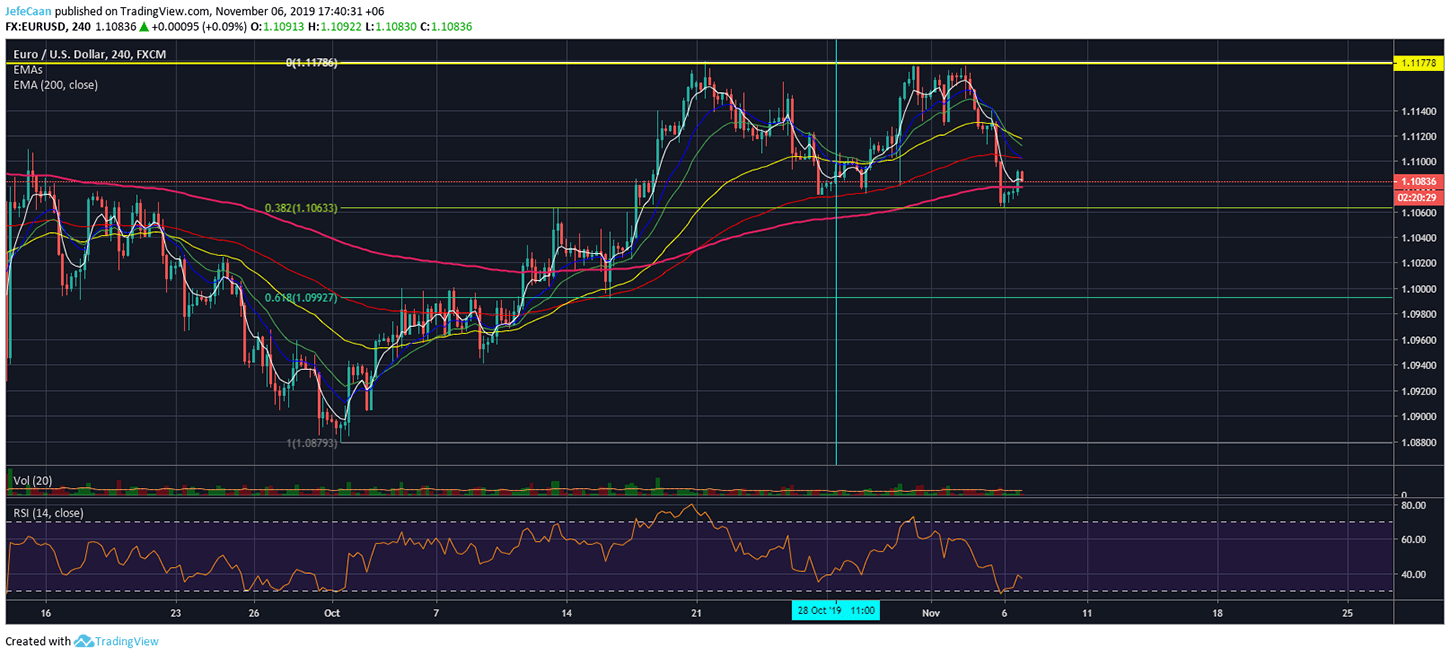
Major indicators that have long impacted the price of Bitcoin (BTC) are lining up to share the same outlook. The 4H chart for the EUR/USD pair shows the price within a strong downtrend that might yet lead to further upside. This happened right after the pair had topped out. It has found temporary support on the 38.2% fib retracement level but it is expected to decline to the next level of support and eventually lower if it declines below the 200 EMA again.
All of this is bad news for BTC/USD and the cryptocurrency market because a strong dollar does not bode well for Bitcoin (BTC). This was a good year for the bulls. People that remained bullish on BTC/USD since the beginning of the year are still above water. The optimism kept building on and now it has peaked. There is no reason to be bullish on BTC/USD around a peak. The S&P 500 (SPX) seems to have topped out as well and is now ready for a correction. In my opinion, an unbiased investor should expect BTC/USD to correct to $4,500 at least and wait and see if it is going to be bullish or bearish from there onwards. The risks are much higher this time and if the stock market enters a major correction, we could be looking at a prolonged bear market in Bitcoin (BTC).
Investment Disclaimer


