Bitcoin
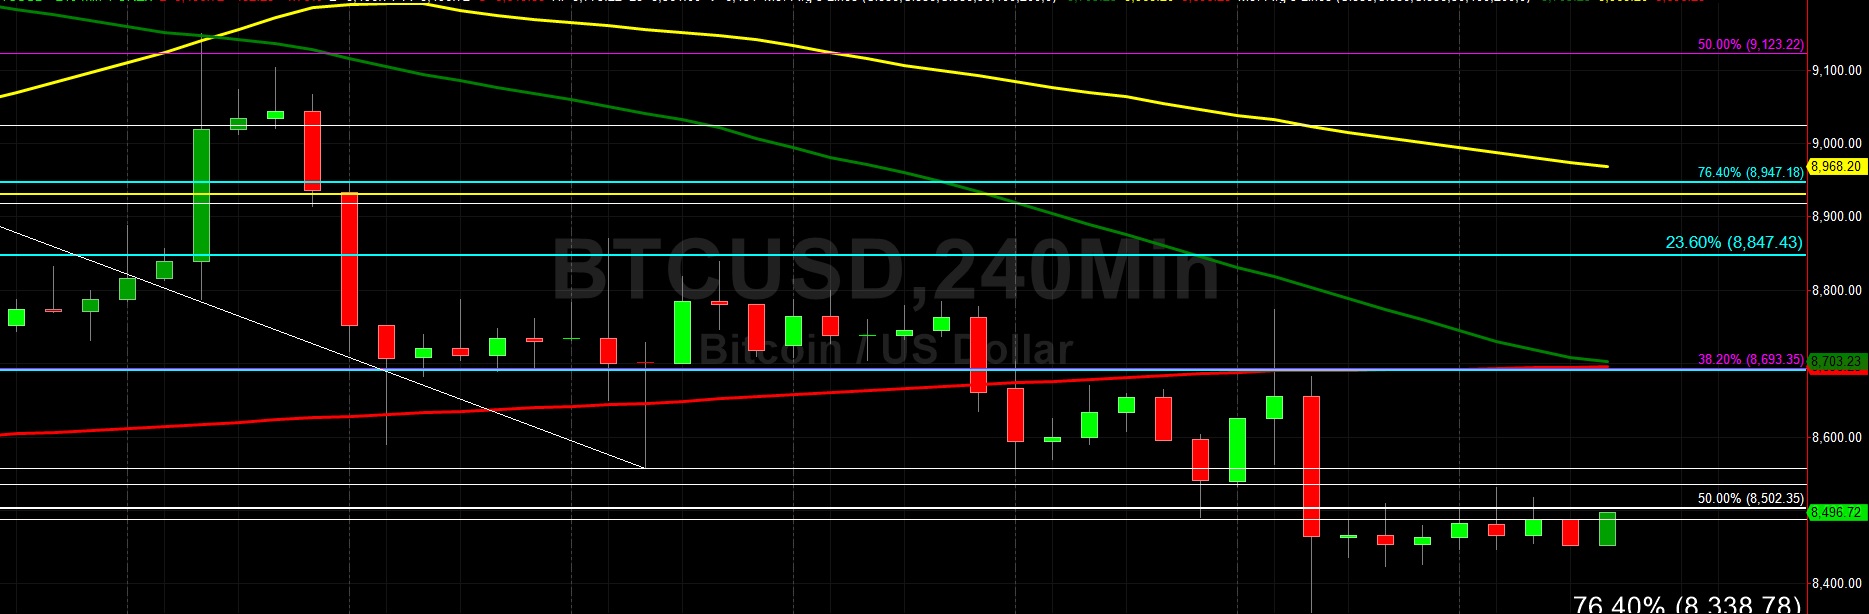
Bitcoin (BTC/USD) gained marginal ground early in today’s Asian session as the pair traded around the 8488.00 area, following several sessions of trading in a very tight range. Traders continue to steadily drive the pair lower in search of technical Support, having knocked BTC/USD as low as the 8361.00 area during Friday’s North American session. Stops were triggered below the 8535.67 level during the pair’s move lower late last week, a level that represents the 61.8% retracement of the late-October 7296.44 – 10540.49 range. The next downside level of potential technical Support related to this range is the 8062.04 area, representing the 76.4% retracement.
Another interesting range that traders are watching is the move from 9948.12 to 3128.89. Notably, Friday’s low was just above the 8338.78 area, representing the 76.4% retracement of that depreciating range. The next downside area of potential technical Support related to that range is the 7343.17 area, representing the 61.8% retracement. The current bearish environment is reinforced by the pair’s trading activity below the 50-bar MA (hourly), 100-bar MA (hourly), and 200-bar MA (hourly). Also, the convergence of 50-bar MA (4-hourly) and 200-bar MA (4-hourly) is also providing traders with a Bearish signal.
Price activity is nearest the 200-bar MA (4-hourly) at 8,699.19 and the 50-bar MA (Hourly) at 8,504.61.
Technical Support is expected around 8338.78/ 8062.04/ 7343.17 with Stops expected below.
Technical Resistance is expected around 9130.00/ 9378.16/ 9774.89 with Stops expected above.
On 4-Hourly chart, SlowK is Bullishly above SlowD while MACD is Bullishly above MACDAverage.
On 60-minute chart, SlowK is Bullishly above SlowD while MACD is Bullishly above MACDAverage.
Ethereum
Ethereum (ETH/USD) appreciated to the 183.17 level early in today’s Asian session after some buying pressure emerged around the 181.74 area during yesterday’s North American session. Market sentiment has recently deteriorated as traders drove the pair as low as the 177.00 figure during Friday’s North American session, stopping short of testing technical Support around the 176.25 area. This level represents the 50% retracement of the 153.00 – 199.50 range. A couple of additional important levels and areas of potential technical Support related to that range include the 170.76 and 163.97 areas, representing the 61.8% and 76.4% retracements.
Another very important area that traders are watching is the 165.25 area, representing the 38.2% retracement of the 302.20 – 80.60 range. That level’s importance was reinforced given the manner in which price activity reacted around the 191.40 area on 10 November, representing the 50% retracement of the same range. Below current market activity, traders anticipate some buying pressure between the 173.86 – 175.04 levels. Also the 172.72 level represents the 23.6% retracement of the 239.45 – 152.11 range, and some Stops are likely situated below this level.
Price activity is nearest the 200-bar MA (4-hourly) at 180.73 and the 50-bar MA (Hourly) at 181.53.
Technical Support is expected around 176.25/ 175.02/ 170.76 with Stops expected below.
Technical Resistance is expected around 187.66/ 191.32/ 194.60 with Stops expected above.
On 4-Hourly chart, SlowK is Bullishly above SlowD while MACD is Bullishly above MACDAverage.
On 60-minute chart, SlowK is Bearishly below SlowD while MACD is Bullishly above MACDAverage.