Litecoin
Litecoin (LTC/USD) fell to the 59.60 level early in today’s Asian session after trading as high as the 66.19 area during yesterday’s North American session. The pair’s recent moves above some important technical levels have given traders some short-term optimism that some additional price appreciation could be result. Last weekend, the pair moved above the 59.97 area, representing the 23.6% retracement of the 182.35 – 22.17 range, and then moved above the 62.46 area, representing the 23.6% retracement of the 192.89 – 22.17 range. Additionally, the 100-bar MA (4-hourly) recently moved above the 200-bar MA (4-hourly), another Bullish development.
Positive short-term market sentiment emerged early Monday this week when price activity tested the 50-bar MA (4-hourly), then indicating around the 61.10 level, and then exploded higher to the 66.10 area, then its strongest print since 24 September. Above that area, traders are eyeing the 67.64 area as an upside price target as it represents the 61.8% retracement of the 80.26 – 47.22 range. Thereafter, the 69.47 area has technical significance as it represents the 61.8% retracement of the 22.17 – 146.00 range, and some Stops are likely in place above there ahead of another upside target, the 72.46 area.
Price activity is nearest the 100-bar MA (4-hourly) at 60.36 and the 100-bar MA (Hourly) at 61.92.
Technical Support is expected around 52.15/ 50.25/ 47.13 with Stops expected below.
Technical Resistance is expected around 66.19/ 69.47/ 75.06 with Stops expected above.
On 4-Hourly chart, SlowK is Bullishly above SlowD while MACD is Bearishly below MACDAverage.
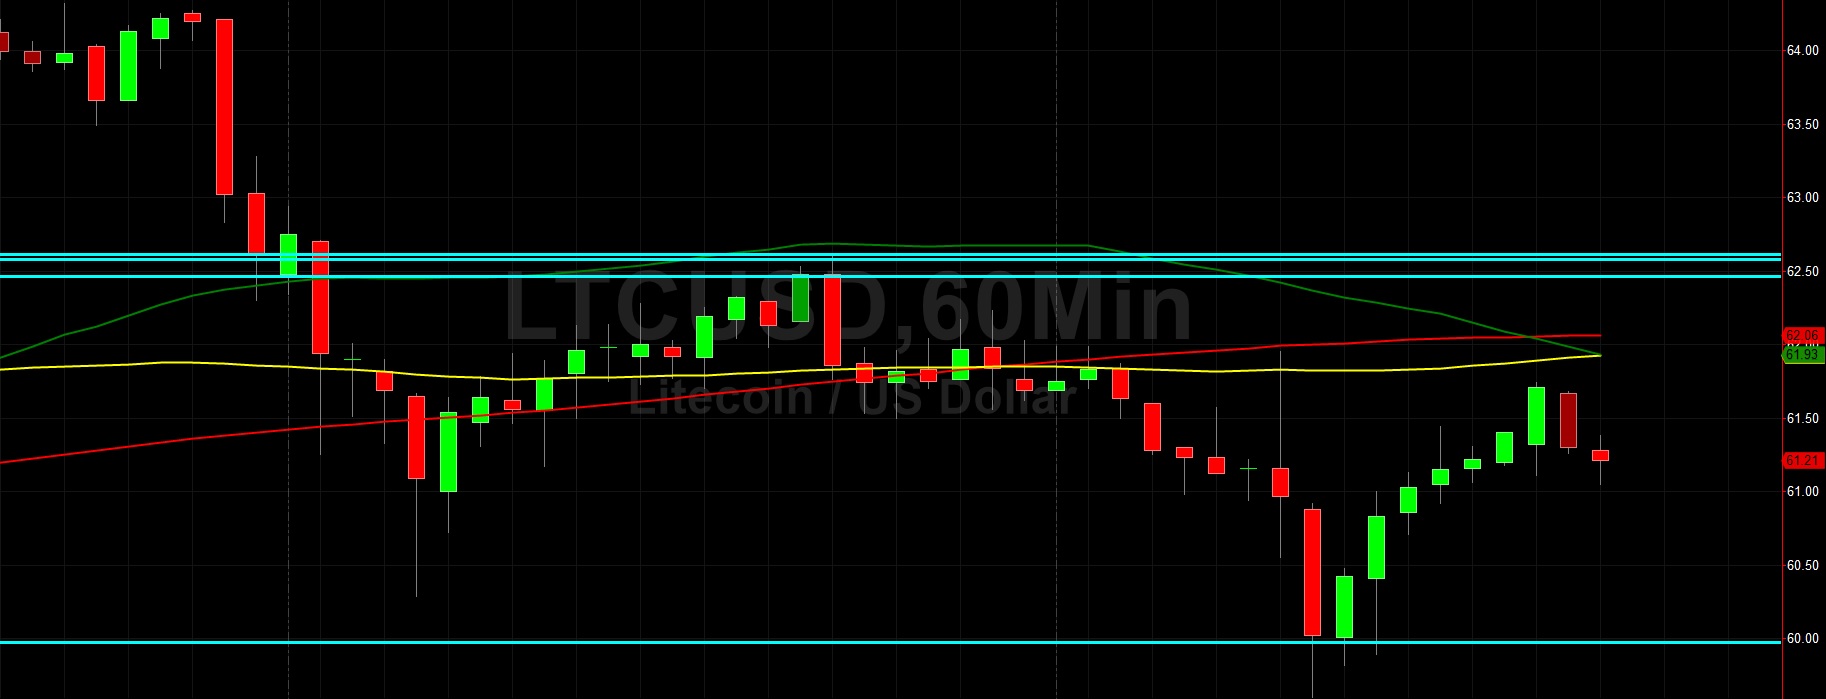
On 60-minute chart, SlowK is Bearishly below SlowD while MACD is Bullishly above MACDAverage.
Bitcoin Cash
Bitcoin Cash (BCH/USD) lost marginal ground early in today’s Asian session as the pair traded as low as the 287.21 area after trading as high as the 291.61 area during yesterday’s European session. The pair’s recent move above the 265.55 area created some short-term optimism as that area is a major technical area that represents the 23.6% retracement of the move from 888.19 to 73.22. BCH/USD bottomed out around the 197.92 area late last month and its recent move above the psychologically-important 300.00 figure was the pair’s strongest showing since late September. Another major technical clue emerged late last week when the pair retraced lower to the 269.10 area and found technical Support around the 100-bar MA (4-hourly).
That buying pressure was also right around the 38.2% retracement of the 590.81 – 72.15 range. An additional level that traders are keeping an eye on is the 295.49 area, representing the 50% retracement of the 73.22 – 517.75 range, and traders note that this level was again tested this week when the market moved to 301.72. Chartists are observing some interesting moves with the 50-bar MA (hourly), 100-bar MA (hourly), and 200-bar MA (hourly) that could be setting the stage for some additional price appreciation. Traders anticipate some possible selling pressure between the 320.66 – 322.41 range, and note that the 331.40 area represents another upside price objective.
Price activity is nearest the 50-bar MA (4-hourly) at 289.35 and the 50-bar MA (Hourly) at 288.26.
Technical Support is expected around 278.25/ 270.94/ 259.29 with Stops expected below.
Technical Resistance is expected around 301.83/ 308.21/ 320.66 with Stops expected above.
On 4-Hourly chart, SlowK is Bullishly above SlowD while MACD is Bullishly above MACDAverage.
On 60-minute chart, SlowK is Bullishly above SlowD while MACD is Bullishly above MACDAverage.