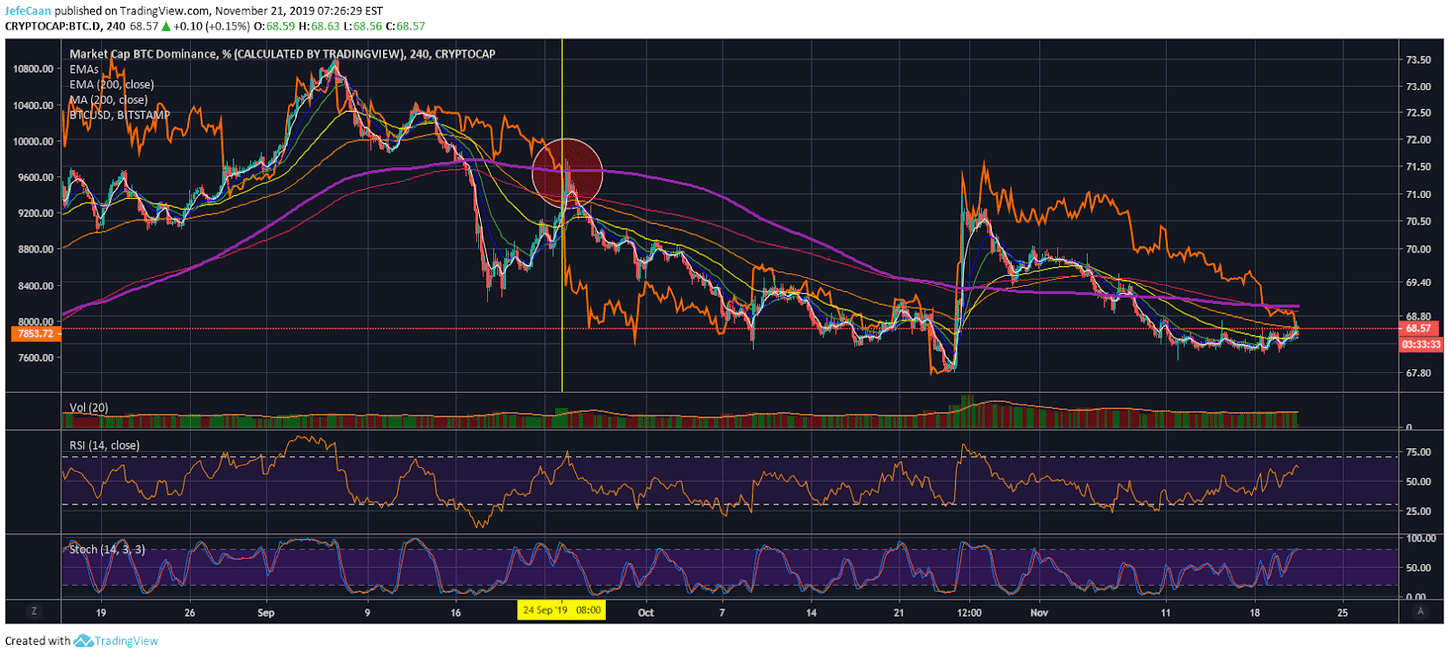
Bitcoin (BTC) dominance is in a short term uptrend and it is now about to run into the 200 moving average on the 4H time frame. The last time this happened was on Sep 24, 2019. A test of that level completely bridged the divergence between dominance and the price and what followed after was a massive crash in the price of Bitcoin (BTC) while dominance stood its ground hence widening the gap once again after a reset. If this plays out like it did the last time, then we would be looking at a set of two or three green candles on the 4H time frame followed by a sharp decline. This is indeed a very bearish development for the overall market and hints at what lies ahead for cryptocurrencies.

We have seen altcoins rally against Bitcoin in the recent past. Most of them have broken past certain key resistance levels against Bitcoin (BTC) but now we are headed towards a correction without altcoins fully completing those moves. This means that any rise in Bitcoin dominance (BTC.D) at his point is likely to be short lived. It might be followed by a strong decline in the market which will hit altcoins harder than Bitcoin (BTC) but we might see a steady decline in dominance afterwards and that would be a time when the altcoin market would rally once again. Even though there is a strong probability that the altcoin market will rally after the next crash in the cryptocurrency market, it is important to note that we are still in a bear market. The altcoin market has yet to experience maximum pain.
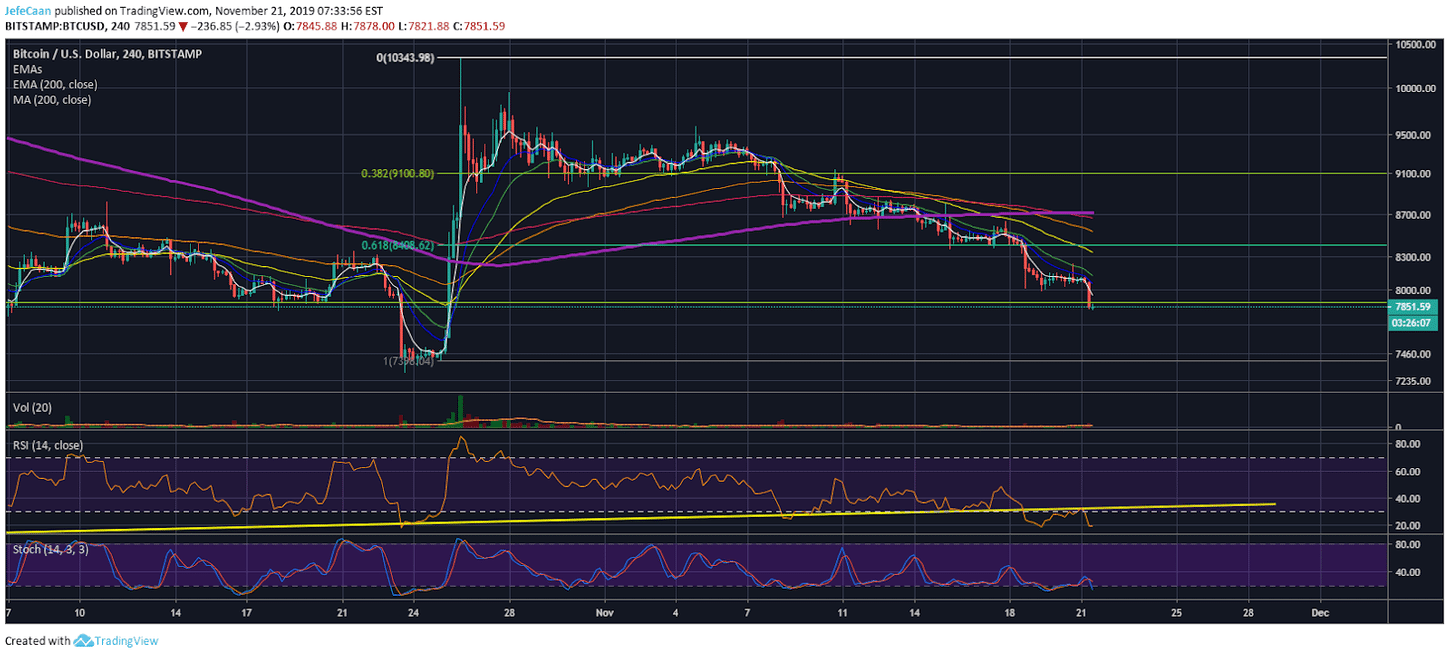
The 4H chart for BTC/USD shows that Bitcoin (BTC) has now broken a key support and it seems to be game over for Bitcoin (BTC) for now. If we don’t see a quick bounce up to the 61.8% from current levels, then Bitcoin (BTC) will be expected to decline towards $6,700 in the near future. This would be more than a 20% crash that could happen before the end of the week. It is very important to trade this as it is rather than speculating on what could be.
If the price holds the 38.2% fib extension level at $7,861 and bounces up from there, then we could be headed towards $8,400 or higher. However, the probability of that happening at this point is very slim. RSI on the 4H chart has broken below a key trend line support. There is not enough bullish momentum to save the price. It even ended up closing below the 38.2% fib extension level which shows us that the bulls have thrown in the towel and not ready to buy the dip. If the price remains close to this level for the next few candles, we can expect a sharp decline below it.