How Low Could Bitcoin (BTC) Fall From Here?
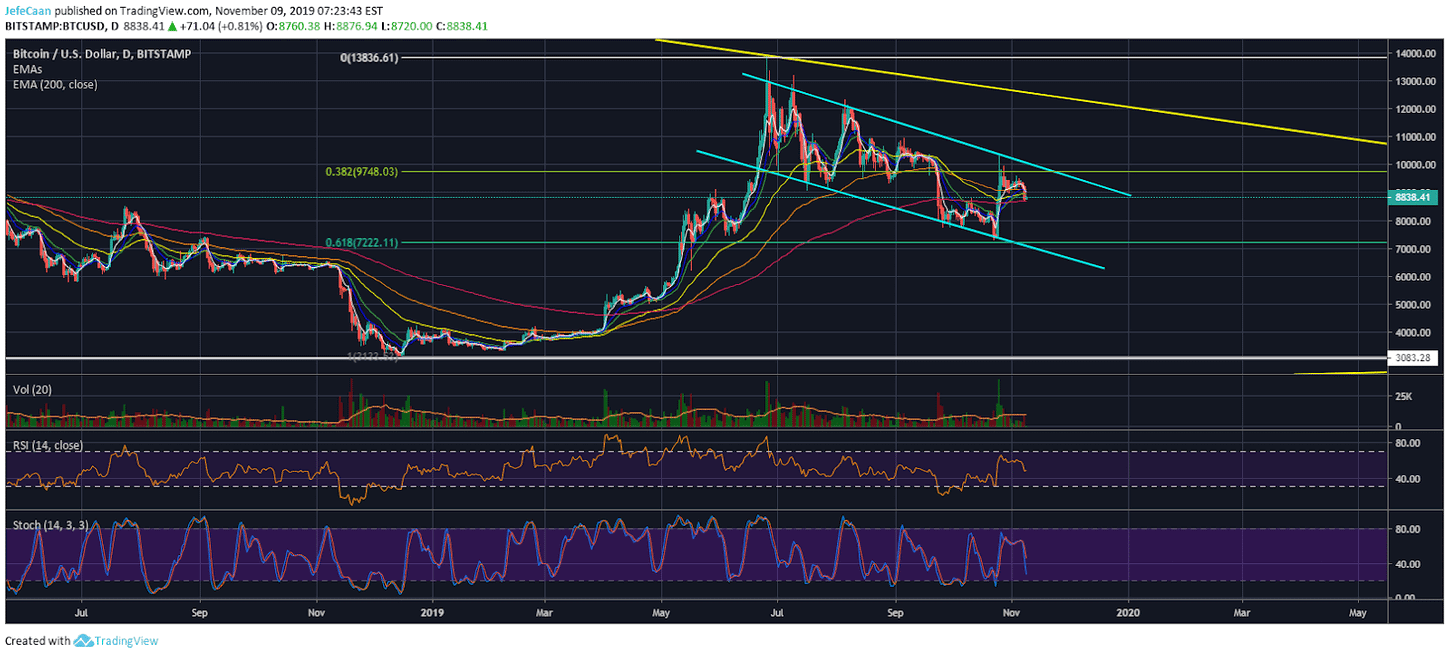
Bitcoin (BTC) has shown obvious signs of weakness and it has repeatedly closed below the 200 EMA on the 4H time frame now. We have yet to see a close below the 21 Week EMA to have further confirmation that BTC/USD has indeed resumed its downtrend. The fractal we see in the making is a lot similar to the one that preceded it which led to a massive decline down to the bottom of the descending channel. If the same were to happen this time, then the price might plunge below $7,222 to test the bottom of the channel but it is likely to find support above $7,222 because that is the 61.8% fib extension level from the December low to the top in June.

The next decline is going to be very significant because we would want to see how the price holds up around the 61.8% fib extension level. Should the price decline below that level in a similar manner to how it has before, then we are likely to see a break below this descending channel which would be a very bearish development that would accelerate the fall towards $4,500. If it declines further to break the symmetrical triangle and enter a descending triangle then we would have further confirmation that BTC/USD has not bottomed and we might see a decline below $3,000 for the price to find its true bottom. There are a lot of traders that are still bullish on BTC/USD at this point. We have yet to see a sharp decline below the 200 EMA on the 4H time frame and for the EMA alignment to turn bearish.
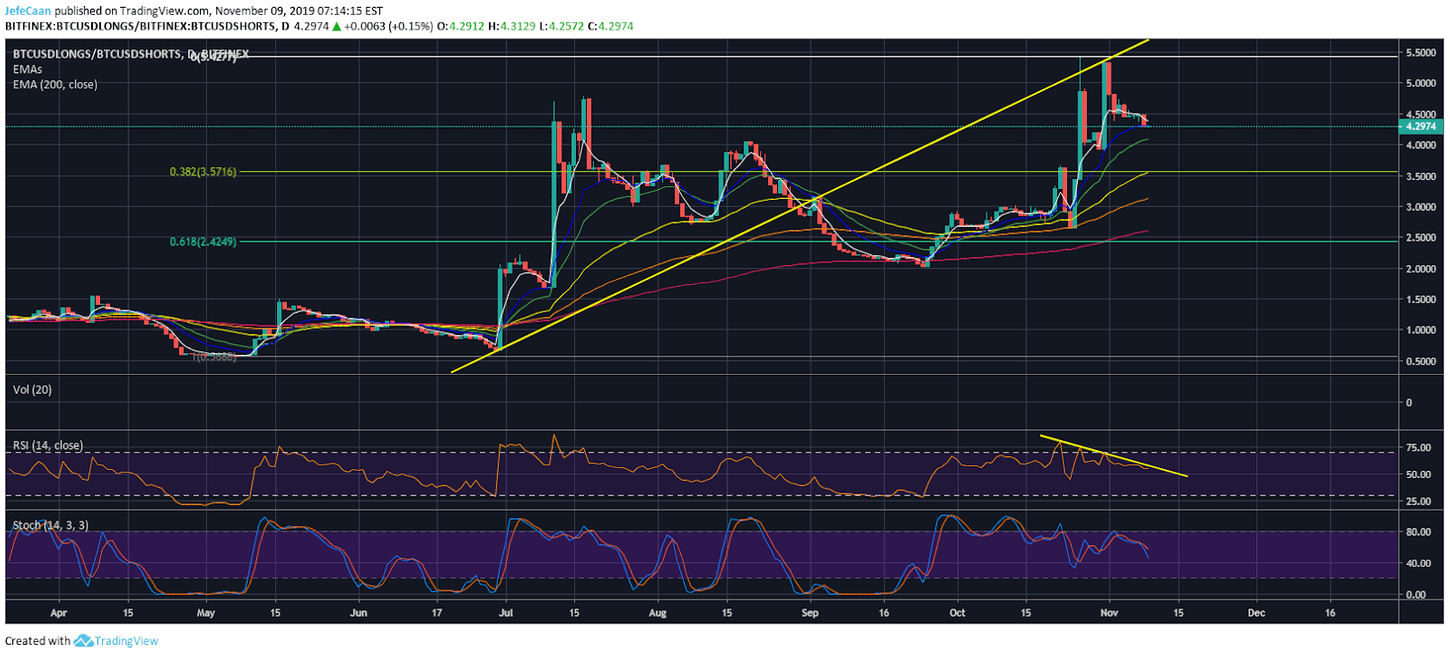
It might take a while for things to unfold on smaller time frames but we have already seen some major red flags on the big picture. The daily chart for BTCUSDLONGS/BTCUSDSHORTS shows us how the ratio is beginning to decline. The trend line resistance on the RSI on this chart shows us that we are very likely to see a sharp decline in the near future. All of these should serve as major warning signs for those looking to be bullish on the market even if they are not prepared to be bearish just yet. One thing that is important to realize in any financial market is that the majority seldom wins. Investors and traders with herd mentality might get lucky here and there but they end up losing most of their gains eventually by following the crowd.
Since the beginning of 2018, we have seen a systemic decline in the price of Bitcoin (BTC) with periods of bullish upside in between. However, we have not seen the market inflict the same kind of pain on the bulls that it has on the bears except for the crash below $6,000. The majority is still too optimistic that we might see a new all-time high and that the price is going to skyrocket after the next halving. When BTC/USD bottomed during the 2014-15 part of the last cycle, it felt like the end of Bitcoin (BTC). Very few people were thinking about a new all-time high as most of them had serious doubts if Bitcoin (BTC) will survive. That is when the weak hands sold into strong hands and we saw a new bullish cycle begin. So far, that exchange has not happened in this market which is why I still expect BTC/USD to decline below $3,000 to find its true bottom.