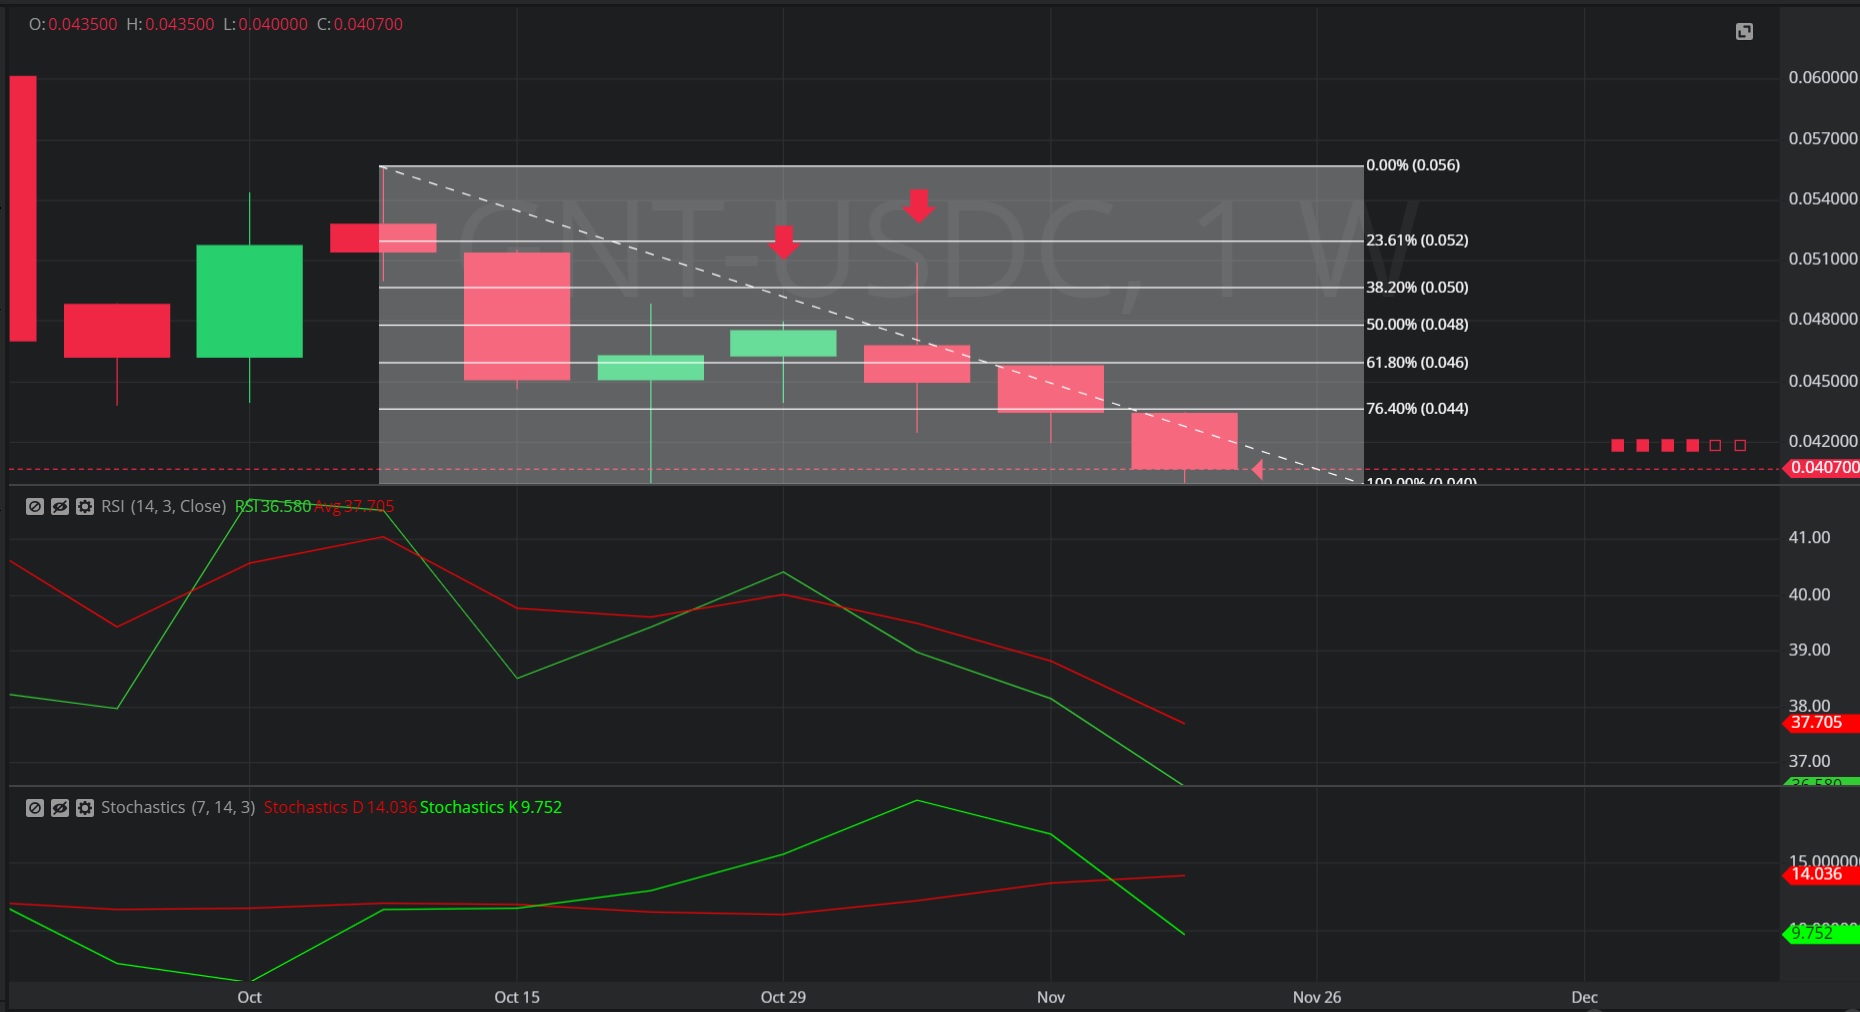
In this Weekly chart of Golem/ USD Coin (GNT/USDC), there is a depreciating range from 0.0556 to 0.0400.
We can see the market appreciated to the 0.048049 level (identified by the first red down arrow), just above the 0.0478 area that represents the 50% retracement of the appreciating range.
We can see the market appreciated further to the 0.050924 level (identified by the second red down arrow), just below the 0.051918 level that represents the 76.4% retracement of the appreciating range.
We can then see that the market depreciated for three consecutive weeks.
Using RSI, we can see that after the price peaked around the 0.050924 level, the slope of both RSI (14) and RSI Average (3) became more negative and remain downwardly sloping, indicative of additional price depreciation.
Using Slow Stochastics, we can see that after the price peaked around the 0.050924 level, the slope of Stochastics K became negative, and Stochastics K and Stochastics D began to converge, indicating probable price depreciation. This was confirmed when Stochastics D crossed above Stochastics K recently, indicating price depreciation likely could continue.
Stay on top of the cryptocurrency market with CryptoDaily’s trading charts!