In this 15-minute chart of Bitcoin/ United States dollar (BTC/USD), there is a depreciating range from 8773.22 to 8361.00.
There is also an appreciating range from 8361.00 to 8510.00.
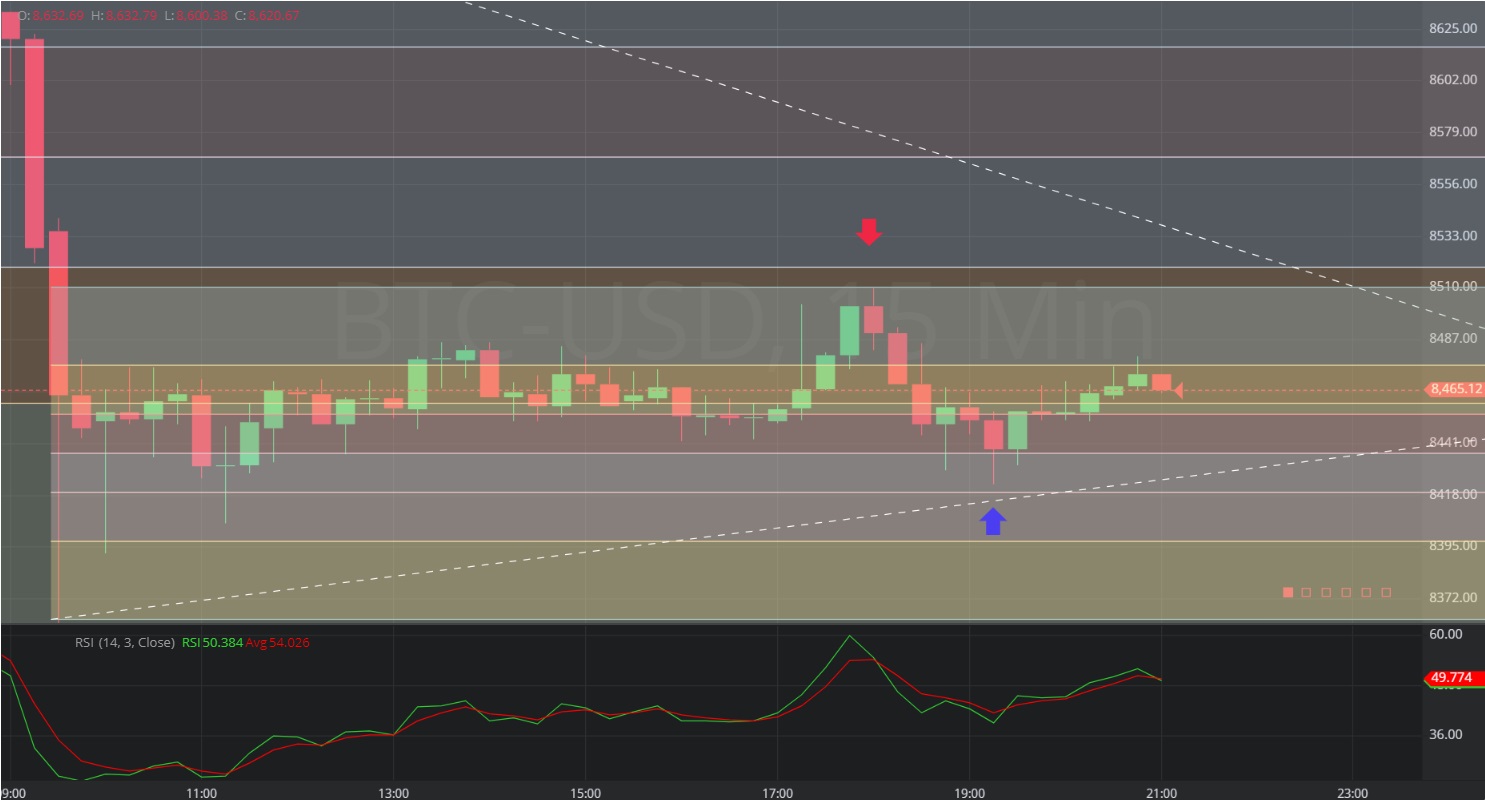
We can see the price appreciated to the 8510.00 level (identified by the red down arrow), just below the 8518.468 level, representing the 38.2% retracement of the depreciating range.
We can see the price then depreciated to the 8423.00 level (identified by the blue up arrow), just above the 8417.918 level, representing the 61.8% retracement of the appreciating range.
Using RSI, the convergence of RSI (14) and RSI Average (3) on the 15-minute bar with a high of 8510.00 along with the negative slope of RSI (14) provided an early indication the market would likely depreciate further. This was confirmed when RSI Average (3) crossed above RSI (14).
Using RSI, the positive slope of RSI (14) and RSI Average (3) and the crossover of RSI Average (3) above RSI (14) on the 15-minute bar with a low of 8431.61 confirmed the subsequent appreciation.
Stay on top of the cryptocurrency market with CryptoDaily’s trading charts!