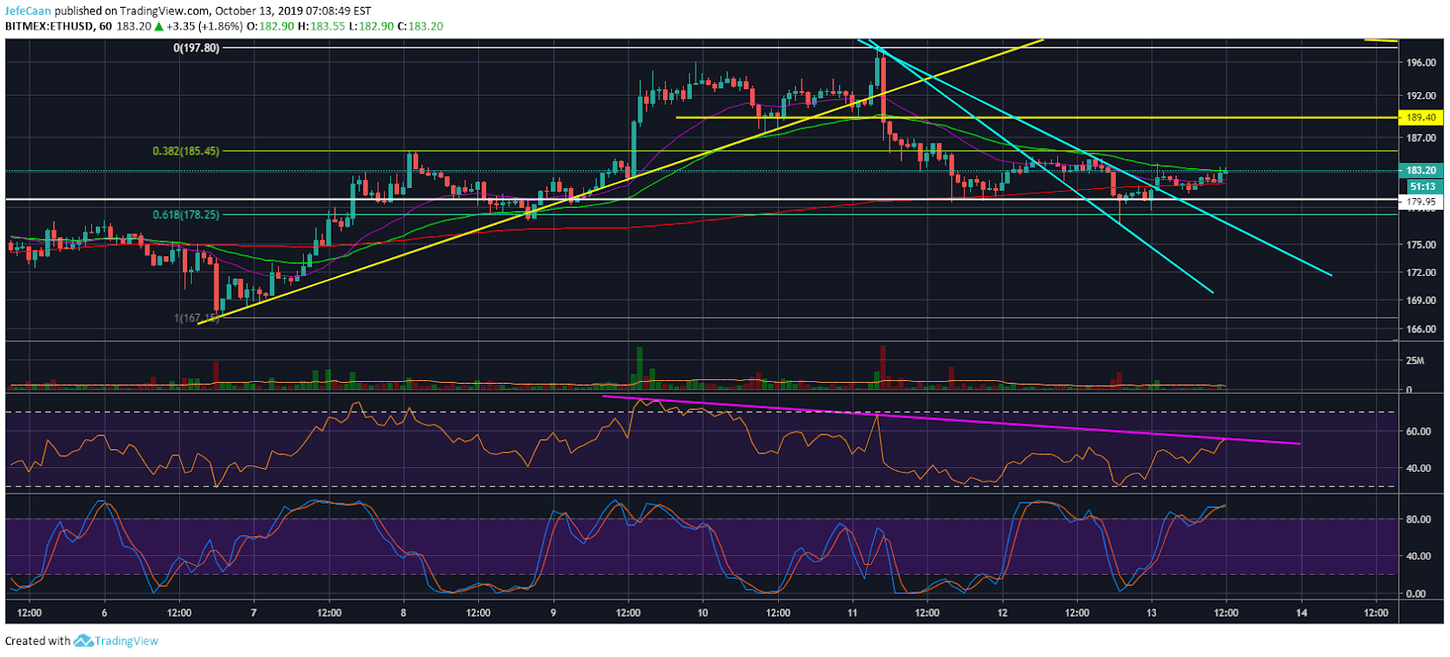
Ethereum (ETH) has just run into the 50 EMA on the 1H time frame and with that it seems to have run out of room for further upside as the RSI points to a clear downtrend that ETH/USD is very unlikely to break out of at this point. The 1H chart for ETH/USD also shows how Ethereum (ETH) faced a rejection once at the 50 EMA before and declined to a trend line resistance turned support. Something similar is likely to happen this time as the RSI has faced rejection whereas the Stochastic RSI has reached overbought conditions. Meanwhile, the 21 EMA risks falling below the 200 EMA which could trigger a sharp decline. Traders need to be very careful trying to long Ethereum (ETH) at current levels thinking it has found a temporary bottom.
It is tempting to long ETH/USD thinking the 21 EMA could soon cross above the 50 EMA. A similar setup can also be seen on the daily time frame. However, the conditions under which the price is trading in tell us that there is a much higher probability of us seeing a bearish crossover rather than a bullish one. If that happens, ETH/USD could decline in a symmetrical manner sharply towards the $167 level or even lower. Regardless of the short term bullishness that we have recently seen, let us not forget that the setup remains bearish and Ethereum (ETH) is very likely to decline sharply sooner or later along with the rest of the market to begin its long awaited downtrend. This is perfectly in line with the big picture not only in this market but also in other large financial markets like the stock, bond and forex markets.

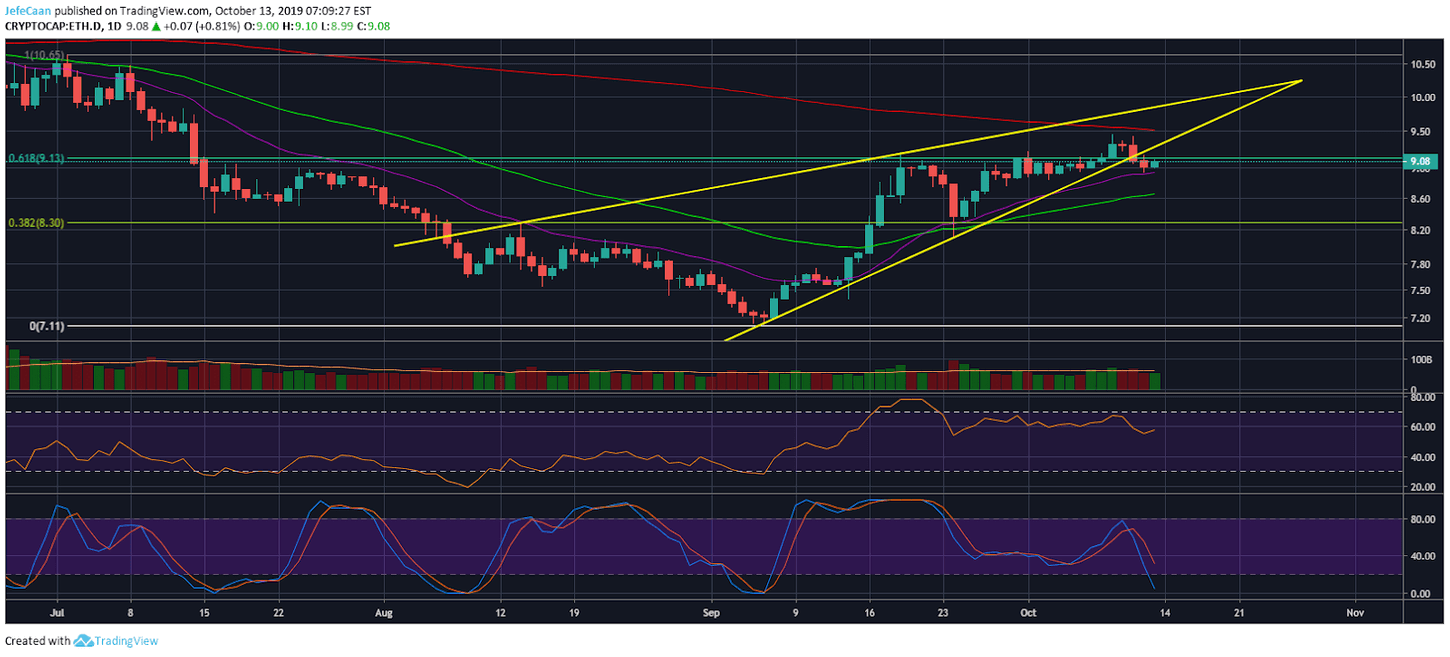
Ethereum dominance (ETH.D) has still not touched the 200 day EMA. We have been waiting for that to happen to get a clear signal as to when Ethereum (ETH) might begin its next downtrend. The last time Ethereum (ETH) declined massively, we saw Ethereum dominance (ETH.D) face a strong rejection at the 200 day EMA. This time that has not happened but we have seen Ethereum dominance (ETH.D) break out of the rising wedge. It closed yesterday below the 61.8% fib retracement level and it is still trading below that level.
Before we see a decline below the 21 day EMA on this chart, I would be very careful entering any short positions. Ethereum (ETH) has a history of making independent moves even when Bitcoin (BTC) is trading sideways. There is no use trying to predict tops and bottoms when all you have to do is to wait for the market to tell you whether the price has topped out or not. Good investors do not care about tops and bottoms. They leave 20% of the top and bottom on the table and take as much as possible in between. When the price declines from current levels, we would be looking at a major downtrend which would last for a long time. This is why it is important to stay focused on the big picture and not enter aggressive shorts to be liquidated only to see the price decline after your account has been wiped out.
Investment Disclaimer


