Sally Ho's Technical Analysis 27 September 2019
Bitcoin
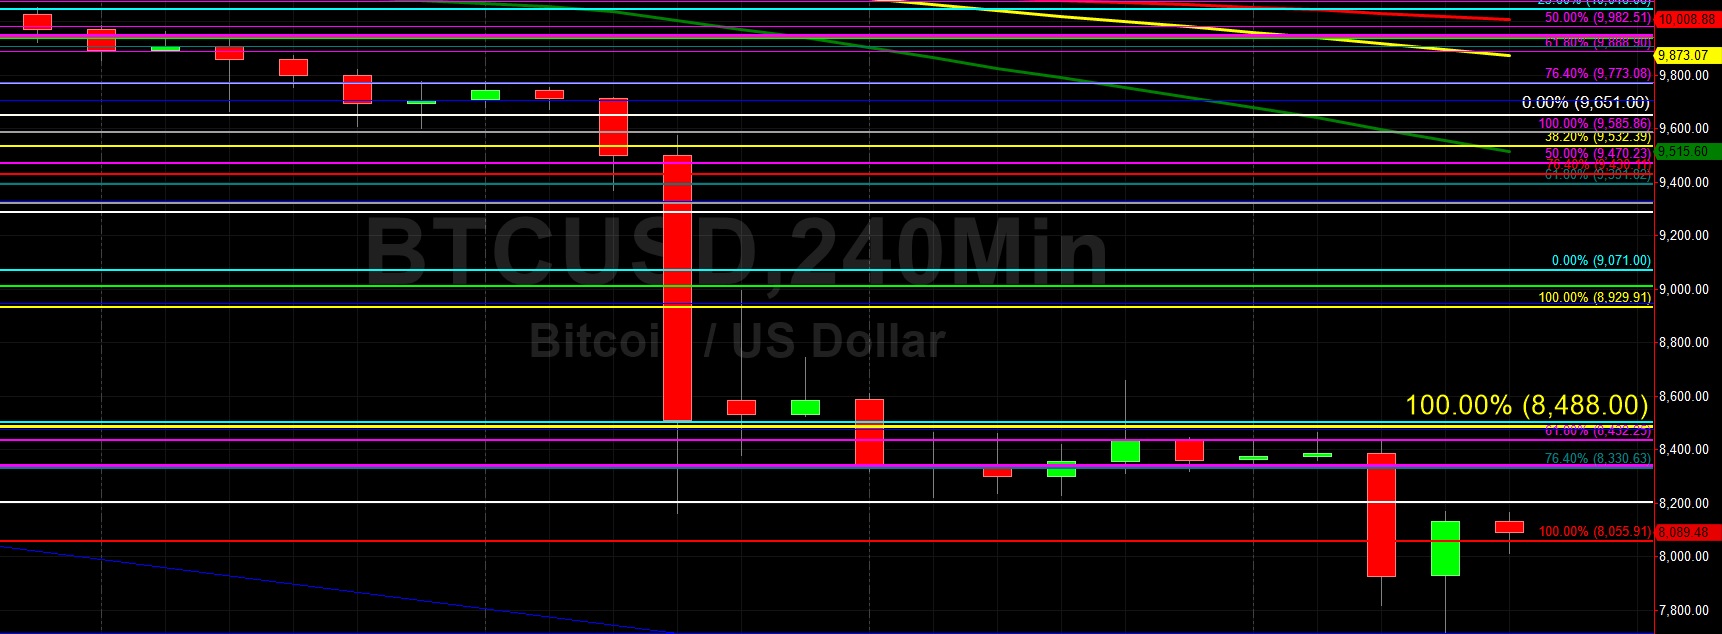
Bitcoin (BTC/USD) experienced ongoing weakness early in today’s Asian session as the pair remained on the defensive after trading as low as the 7712.45 level during yesterday’s North American session following its recent abrupt decline below the psychologically-important 10000 figure this week. The pair’s market bias shifted decisively when BTC/USD Bears dominantly knocked the pair lower to its weakest levels since June of this year, trading as low as the 8159.35 area, before late-week selling added more pressure. The strength of the Bears was evident when they triggered a huge amount of Stops below key levels, including the 9009.65 area that represents the 76.4% retracement of the 7508.88 – 13868.44 range. The pair is now trading well below its 50-bar MA (4-hourly), 100-bar MA (4-hourly), and 200-bar MA (4-hourly).
Traders are observing major levels that BTC/USD must now contend with as its short-term bias is determined. The 8502.35 area represents the 50% retracement of the major move from 3136.25 to 13868.44 and traders are very interested to see if this level becomes technical Support or technical Resistance in the short-term and mid-term. Others important levels include the 8203.91 area, a level that is the 61.8% retracement of the move from 4702.53 to 13868.44. Below current market activity, traders are paying close attention to levels such as 7235.95, the 61.8% retracement of the 3136.25 – 13868.44 range. Also, the 6865.68 area is another important technical level that traders are focusing on.
Price activity is nearest the 50-bar MA (4-hourly) at 9,516.37 and the 50-bar MA (Hourly) at 8,355.84.
Technical Support is expected around 8,055.91/ 7,508.77/ 7,223.25 with Stops expected below.
Technical Resistance is expected around 9,071.00/ 9,651.00/ 10,097.80 with Stops expected above.
On 4-Hourly chart, SlowK is Bullishly above SlowD while MACD is Bearishly below MACDAverage.
On 60-minute chart, SlowK is Bullishly above SlowD while MACD is Bullishly above MACDAverage.
Ethereum
Ethereum (ETH/USD) encountered some buying pressure up to the 167.71 area early in today’s Asian session following its recent massive depreciation below the psychologically-important 200.00 figure that saw the 157.75 area print this week, its weakest showing since May. Traders lifted the pair higher from the 152.11 level during yesterday’s North American session. The pair is now trading far below its 50-bar MA (4-hourly), 100-bar MA (4-hourly), and 200-bar MA (4-hourly) and is also now trading below its 50-bar MA (hourly), 100-bar MA (hourly), and 200-bar MA (hourly). Some traders believe ETH/USD will be drawn to the psychologically-important 150.00 level.
Given the major pullback in ETH/USD, traders are now evaluating whether recent technical Support will become technical Resistance. One such level is the 162.53 area, representing the 76.4% retracement of the 100.15 – 364.49 range. Below current market activity, ETH/USD Bears could try to target the 147.60 area, another major downside target. Above current market activity, the 173.55 and 183.33 are also being closely observed, as is the 172.88 area representing the 38.2% retracement of the 322.16 – 80.60 range.
Price activity is nearest the 200-bar MA (4-hourly) at 185.53 and the 50-bar MA (Hourly) at 167.61.
Technical Support is expected around 147.60/ 144.19/ 136.34 with Stops expected below.
Technical Resistance is expected around 172.88/ 176.60/ 183.33 with Stops expected above.
On 4-Hourly chart, SlowK is Bullishly above SlowD while MACD is Bullishly above MACDAverage.
On 60-minute chart, SlowK is Bullishly above SlowD while MACD is Bullishly above MACDAverage.
