Sally Ho's Technical Analysis 26 September 2019
Bitcoin
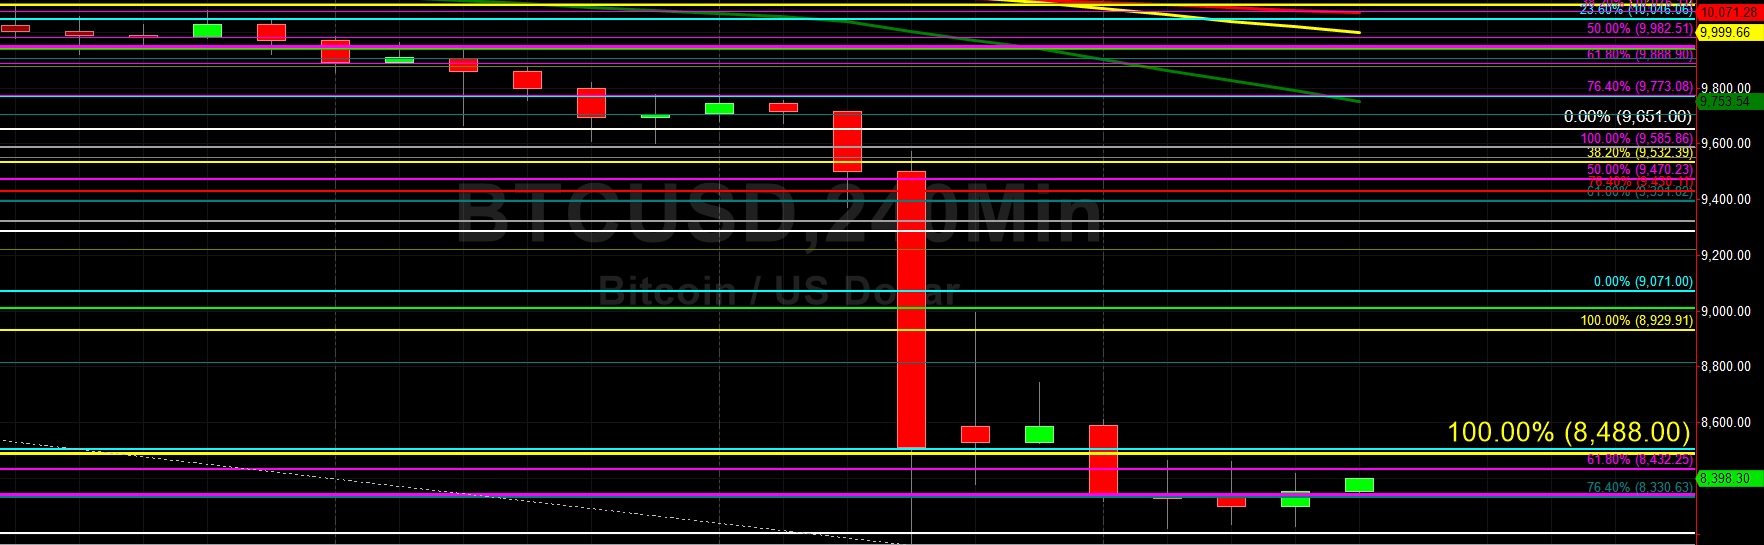
Bitcoin (BTC/USD) continued to trade well below the psychologically-important 10000 figure early in today’s Asian session as the pair was slightly stronger up around the 8399.99 area after trading as low as the 8228.00 area during yesterday’s North American session. Traders reevaluated BTC/USD market risk this week in a major way when they pushed the pair to the 8159.35 area on 24 September, its weakest print since June of this year prior to the pair’s sharp move higher to the 13868.44 area. Major Stops were elected below the 9009.65 area during the pair’s depreciation this week, a level that represents the 76.4% retracement of the move from 7508.88 to 13868.44.
Traders paid close attention to the 8203.91 area during the pair’s move lower this week, a level that represents the 61.8% retracement of the move from 4702.53 to 13868.44. The pair’s next downside level in this range is 6865.68 and traders will see if BTC/USD Bears are able to keep the pair below the 9285.48 level, the next upside level in the range. Another major downside price target that chartists are closely observing is the 7235.95 area, representing the 61.8% retracement of the move from 3136.25 to 13868.44. The 8502.35 level is the 50% retracement of this range and traders are paying close attention to see how the pair trades around this level.
Price activity is nearest the 50-bar MA (4-hourly) at 9,864.37 and the 50-bar MA (Hourly) at 9,298.05.
Technical Support is expected around 8,055.91/ 7,508.77/ 7,223.25 with Stops expected below.
Technical Resistance is expected around 9,071.00/ 9,651.00/ 10,097.80 with Stops expected above.
On 4-Hourly chart, SlowK is Bullishly above SlowD while MACD is Bearishly below MACDAverage.
On 60-minute chart, SlowK is Bearishly below SlowD while MACD is Bearishly below MACDAverage.
Ethereum
Ethereum (ETH/USD) continued to trade well below the psychologically-important 200.00 figure early in today’s Asian session as the pair was lifted up to the 169.81 area following its massive move lower to the 157.75 area on 24 September. Major Stops were elected below the 189.05 area during the pair’s move lower this week, a level that represents the 61.8% retracement of the 80.60 – 364.49 range. If ETH/USD Bears are able to continue to push the pair lower, the next downside price objective in that range is the 147.60 area.
Chartists are also paying very close attention to the 162.53 area, a level that represents the 76.4% retracement of the 100.15 – 364.49 range. Above current market activity, it is likely that additional technical Resistance may mount around the 189.05 and 201.13 levels. Traders are also very curious to see how the pair trades around the 173.55, 183.33, and 191.23 areas. The 150.00 figure will also likely emerge as a psychologically-important level.
Price activity is nearest the 200-bar MA (4-hourly) at 205.36 and the 50-bar MA (Hourly) at 188.34.
Technical Support is expected around 157.39/ 148.91/ 136.34 with Stops expected below.
Technical Resistance is expected around 183.33/ 191.23/ 199.13 with Stops expected above.
On 4-Hourly chart, SlowK is Bullishly above SlowD while MACD is Bearishly below MACDAverage.
On 60-minute chart, SlowK is Bullishly above SlowD while MACD is Bearishly below MACDAverage.
