Sally Ho's Technical Analysis 16 September 2019
Bitcoin
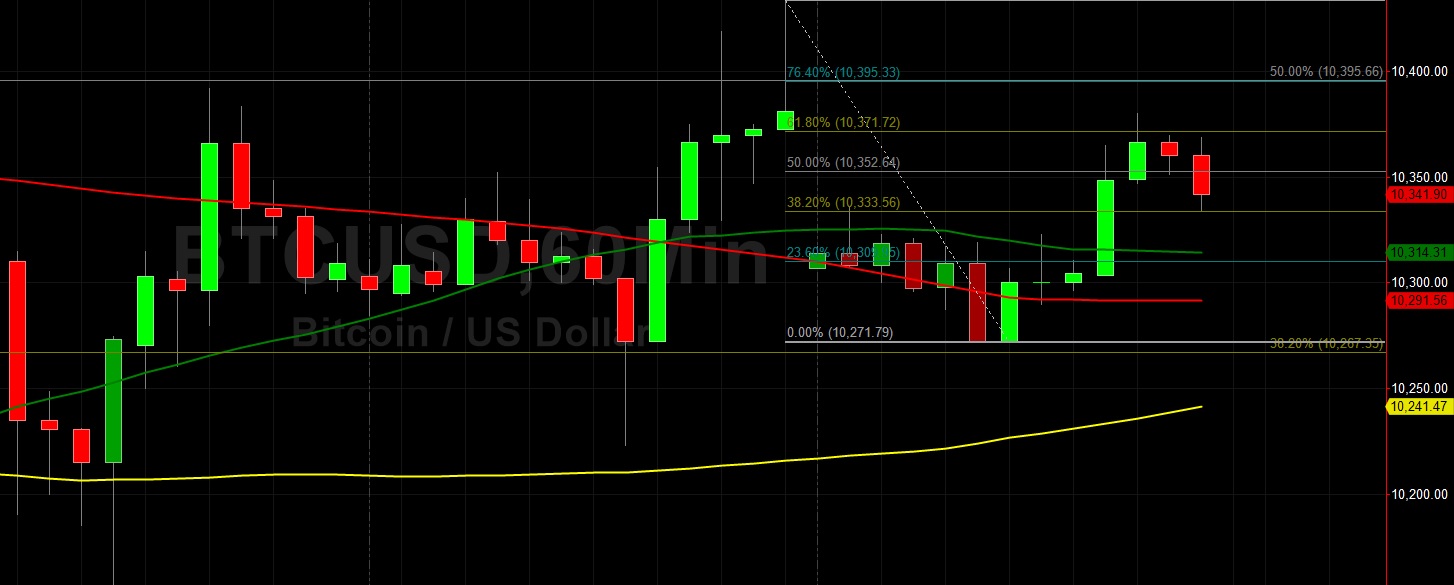
Bitcoin (BTC/USD) rallied higher early in today’s Asian session as the pair traded as high as the 10379.98 area after Bids emerged around the 10271.70 area late in yesterday’s North American session. The pair had a volatile weekend that saw it climb higher from the 10233 area on Saturday, consolidate gains, and then finds Bids late yesterday around the 38.2% retracement of the 10939.34 – 9851.97 range. Some Stops were elected above the 10371.72 area early in today’s Asian session, representing the 61.8% retracement of the 10433.49 – 10271.78 range.
If BTC/USD’s upward momentum can continue, traders will need to challenge the 10395 area, an important technical level related to the aforementioned range and also a recent range with the 10939 area as a relative high. Chartists are observing the pair’s recent movements above the 50-bar MA (4-hourly) and movements above the 50-bar MA (hourly). Above current market activity, the 10541, 10682, and 10820 areas are upside price objective targets.
Price activity is nearest the 50-bar MA (4-hourly) at 10,292.47 and the 50-bar MA (Hourly) at 10,314.76.
Technical Support is expected around 9,765.93/ 9,532.39/ 9,265.49 with Stops expected below.
Technical Resistance is expected around 10,833.14/ 11,136.82/ 11,759.72 with Stops expected above.
On 4-Hourly chart, SlowK is Bullishly above SlowD while MACD is Bullishly above MACDAverage.
On 60-minute chart, SlowK is Bullishly above SlowD while MACD is Bullishly above MACDAverage.
Ethereum
Ethereum (ETH/USD) exploded higher early in today’s Asian session as the pair traded as high as the 195.75 area, a continuation of the steady buying pressure that commenced on Friday when Bids emerged around the 177.57 area around the 50-bar MA (4-hourly). The pair has not traded this high since 23 August and some sizable Stops were triggered above the 191.40 area, representing the 50% retracement of the 302.20 – 80.60 range. A couple of immediate upside price targets for the pair include the 196.35 and 197.56 levels.
Chartists are observing some levels between the 202.38 and 206.18 areas where Offers are likely in place above current market activity. Prior to testing those areas, however, ETH/USD would need to test the psychologically-important 200.00 figure. The technical significance of the 188.38 area was reinforced early in today’s Asian session when ETH/USD bounced higher off this area multiple times, a level that represents the 61.8% retracement of the 255.00 – 80.60 range. Below market activity, traders will be curious to see how the 183.33 area behaves during pullbacks.
Price activity is nearest the 200-bar MA (4-hourly) at 183.22 and the 50-bar MA (Hourly) at 183.08.
Technical Support is expected around 188.38/ 183.88/ 181.95 with Stops expected below.
Technical Resistance is expected around 202.38/ 206.18/ 209.75 with Stops expected above.
On 4-Hourly chart, SlowK is Bullishly above SlowD while MACD is Bullishly above MACDAverage.
On 60-minute chart, SlowK is Bullishly above SlowD while MACD is Bullishly above MACDAverage.
