Bitcoin
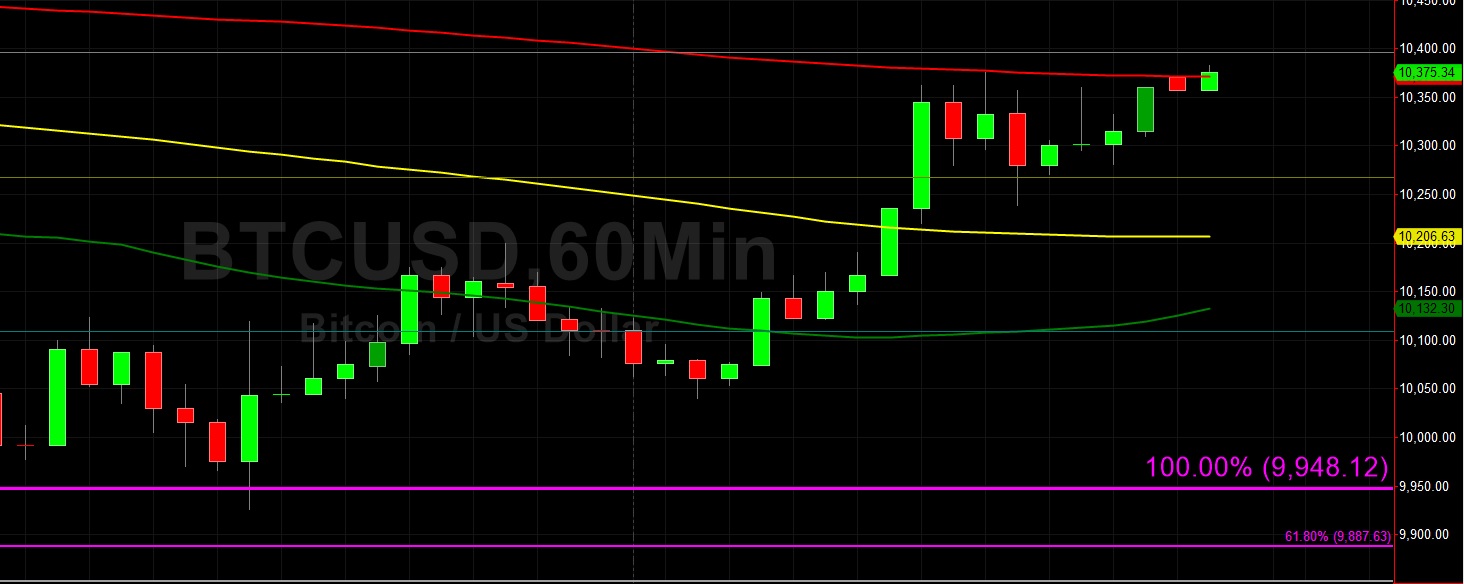
Bitcoin (BTC/USD) moved higher early in today’s Asian session as the pair escalated to the 10359.92 area following upward buying pressure that intensified during yesterday’s European session when Bids emerged just below the 10046.06 area, right around the 23.6% retracement of the move from 13202.63 to 9071. This upward pressure followed earlier upward pressure that emerged during yesterday’s Asian session just below the 9938.16 area, representing the 61.8% retracement of the 7508.88 – 13868.44 range.
Traders are observing some probable Stops above the 10378.96 area that could be elected in the near-term, just above the 76.4% retracement of the recent 10541.75 – 9851.97 range. Likewise, the 10395 area is an important level related to BTC/USD’s recent depreciation from the 10939.34 area. Above current market activity, the 10523 and 10682 areas represent upside price objectives. Below current market activity, the 10108 and 9765 areas represent downside price objectives.
Price activity is nearest the 50-bar MA (4-hourly) at 10,363.78 and the 200-bar MA (Hourly) at 10,371.41.
Technical Support is expected around 9,765.93/ 9,532.39/ 9,265.49 with Stops expected below.
Technical Resistance is expected around 10,833.14/ 11,136.82/ 11,759.72 with Stops expected above.
On 4-Hourly chart, SlowK is Bullishly above SlowD while MACD is Bullishly above MACDAverage.
On 60-minute chart, SlowK is Bullishly above SlowD while MACD is Bullishly above MACDAverage.
Ethereum
Ethereum (ETH/USD) rallied higher early in today’s Asian session as the pair traded as high as the 180.87 area following a steady upward stream of buying activity that emerged during Wednesday’s North American session above the 173.02 area. During yesterday’s European session, buying pressure emerged right around the 100-bar MA (4-hourly), then indicating around the 176.35 area, and later around the 50-bar MA (4-hourly). Bids later materialised around the 177.97 and 178.98 areas, indications that short-term price movements would be higher.
Chartists are noting that the 181.04 area was toppish during yesterday’s North American session, right around the 23.6% retracement of the 164.99 – 186.00 range. If the upward price activity continues, traders will need to test the 183.33 area, representing the 23.6% retracement of the 515.88 – 80.60 range. Above that area, the 200-bar MA (4-hourly) is now indicating around the 185.15 area. Price activity has also moved above the 200-bar MA (hourly), 50-bar MA (hourly), and 100-bar MA (hourly).
Price activity is nearest the 50-bar MA (4-hourly) at 177.51 and the 100-bar MA (Hourly) at 179.58.
Technical Support is expected around 172.88/ 167.80/ 165.25 with Stops expected below.
Technical Resistance is expected around 188.38/ 191.40/ 201.38 with Stops expected above.
On 4-Hourly chart, SlowK is Bullishly above SlowD while MACD is Bullishly above MACDAverage.
On 60-minute chart, SlowK is Bullishly above SlowD while MACD is Bullishly above MACDAverage.