Bitcoin (BTC) Bulls Not Prepared To Back Down Just Yet
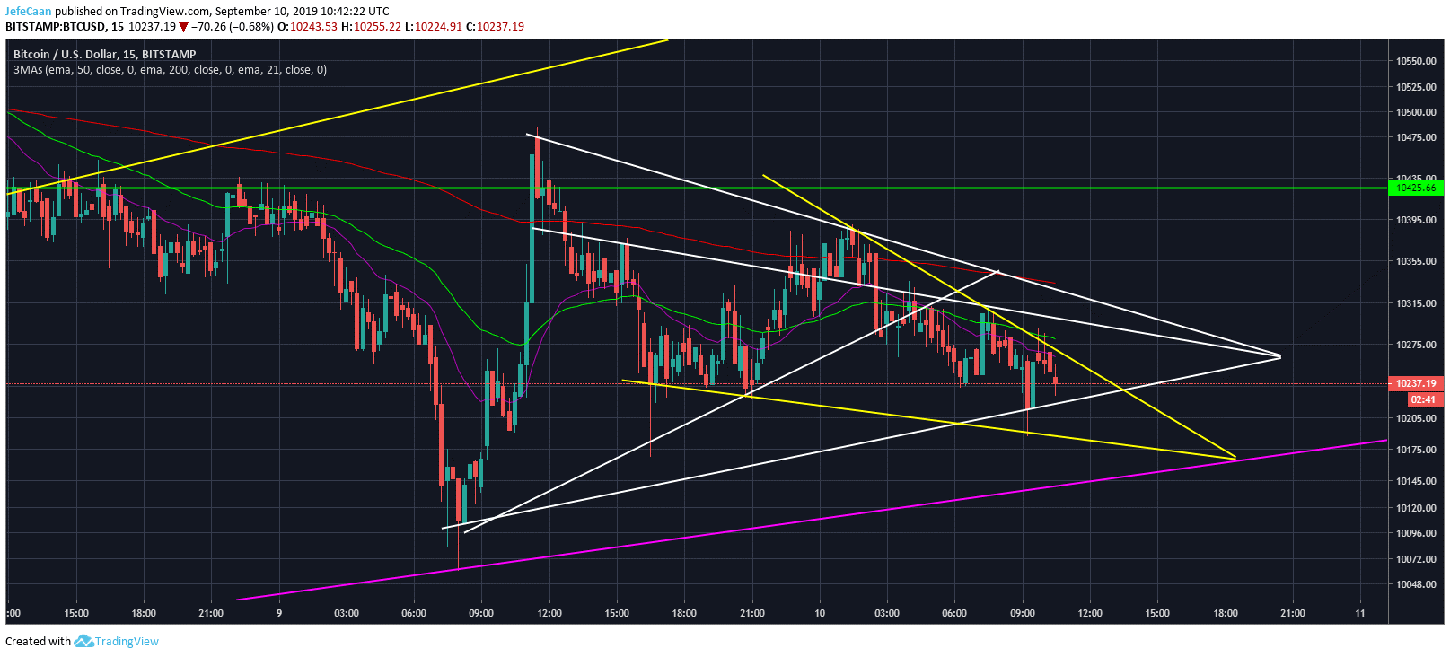
Bitcoin (BTC) is trading within a falling wedge at a time when the bulls are not prepared to back down. The 15 min chart for BTC/USD shows that attempts to break lower have been followed by traders buying the dips. This is nothing surprising to see considering a lot of traders are still waiting with long positions to capitalize on the upcoming Bakkt launch on September 23, 2019. I for one would be very surprised if the price keeps on surging towards $11,000 as the Bakkt launch nears but sideways movement in anticipation of a breakout is within the realm of high probabilities. I think Bakkt is going to be the catalyst that a lot of traders are going to be looking up to as Bitcoin (BTC)’s savior to help it rally towards a new yearly high.

For now, there is no denying that the price is poised for a bullish reversal short term. We are likely to see a break out of the falling wedge towards the top of the pennant. Considering that it is a bullish pennant, there is a strong probability of the price breaking towards $10,425 and even higher. It would be important to keep an eye on the 50 EMA on the 1H time frame. If that is breached, then we will have confirmation that further upside is likely short term. We discussed the trend line support earlier which still remains very much intact. It has not been breached once and the price is likely to keep on rallying or trading sideways until that trend line support is broken.
Bitcoin (BTC) is bullish short term but we need not to lose sight of the big picture in pursuit of short term gains. Bitcoin (BTC) remains at a very high risk of a sharp selloff long term and it has yet to begin the second half of the bear market. The temporary bullishness that we see for now is likely to remain in the market until the launch of Bakkt later this month but that does not mean that the price will keep on rallying until then. It just means that the sentiment will turn very optimistic again shortly before the major decline.
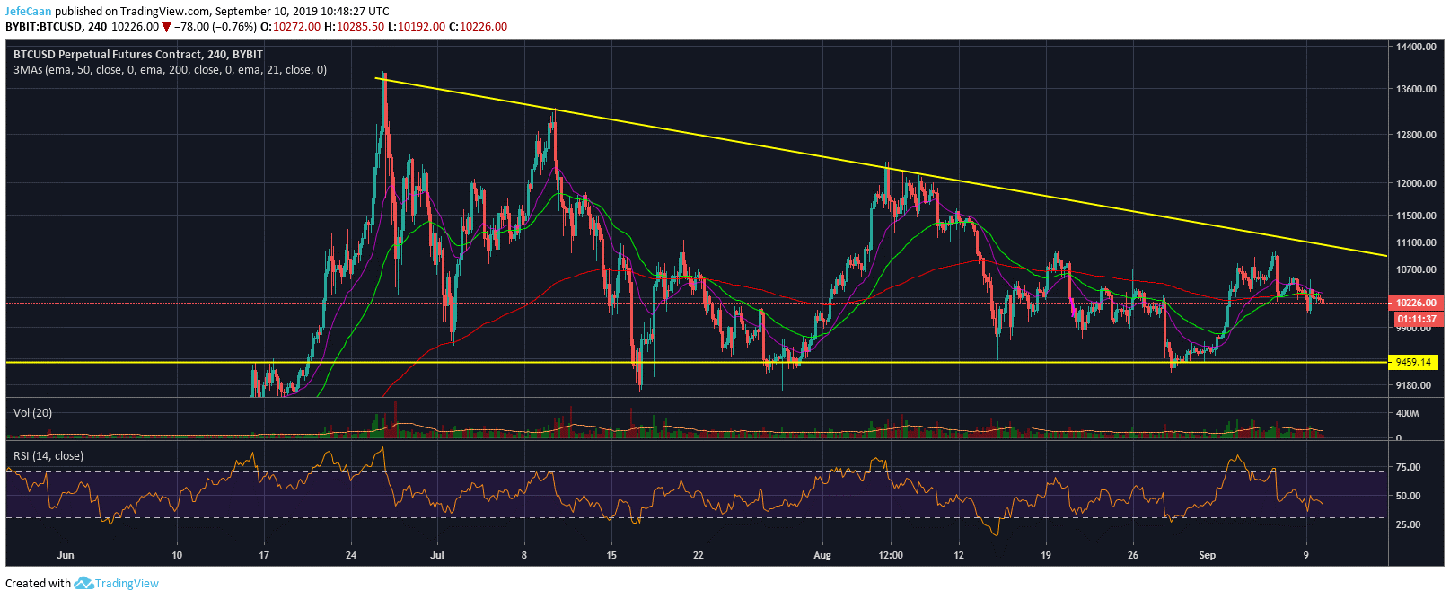
The 4H chart for BTC/USD shows that the price ended up testing the bottom of the descending triangle earlier but it has not touched the top again. If we were to compare the current price action with that of 2014 before the major decline that led to a more than 80% downside, it would be reasonable to expect that the price may not end up rallying that high. However, it is very important to realize that we cannot base investment decisions based on what has happened in the past alone. There is nothing stopping the price from rallying towards the top of the descending triangle. However, it would be quite unreasonable to bet on the price doing that because the risk/reward is simply not worth it.