Sally Ho's Technical Analysis 3 August 2019
Bitcoin
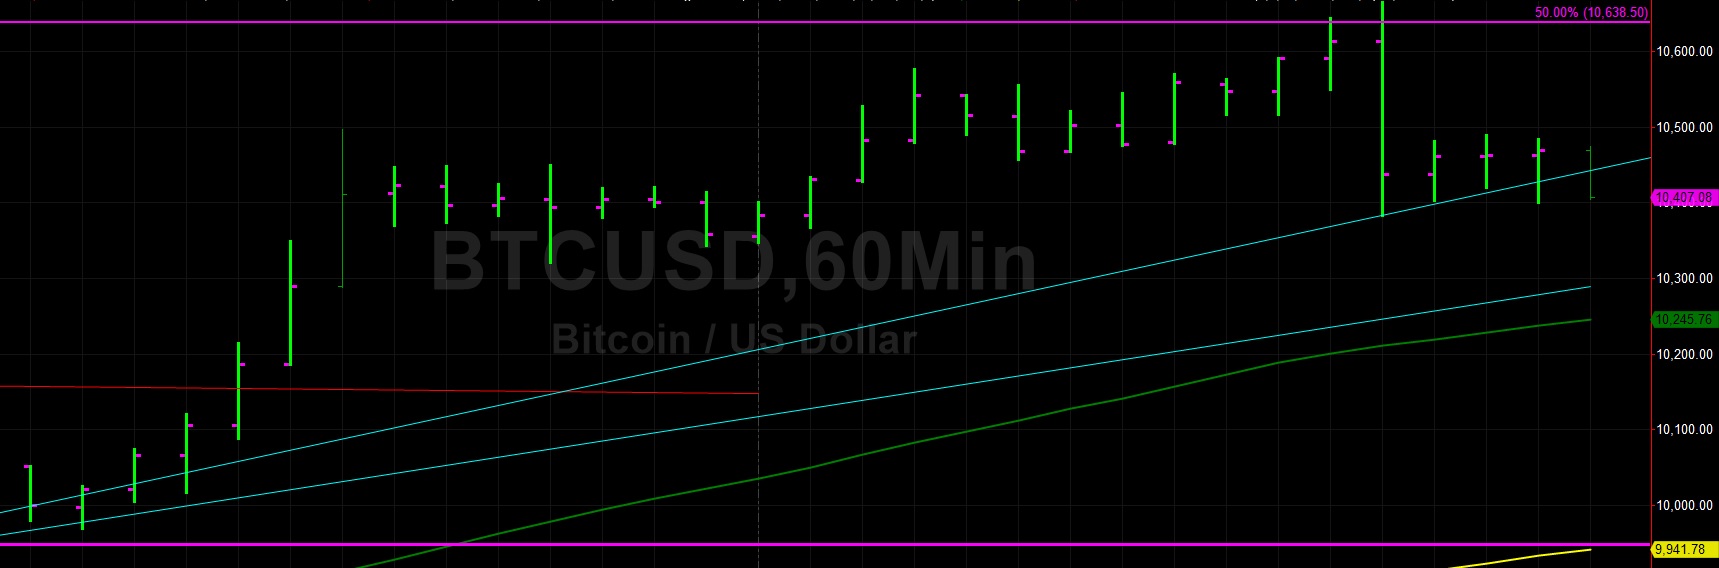
Bitcoin (BTC/USD) gave back some of yesterday’s gains early in today’s Asian session as the pair fell to 10,431.75 after escalating higher to the 10,670.00 level during yesterday’s North American session. Steady buying activity has been seen over the past two days and the pair tested the 50% retracement of the 7,508.77 – 13,868.44 range before profit-taking ensued today. The next upside price objective relating to that range is the 11,439.05 area, and the next downside price objective relating to that range is the 9,938.16 level.
BTC/USD’s upside was also capped by the 200-bar MA (4-hourly), currently indicating around the 10,645.88 area. The 100-bar MA (hourly) crossed above the 200-bar MA (hourly) during yesterday’s Asian session and this coincided with additional price appreciation. The pair decisively absorbed upside technical Resistance around the 10,548.63 area and chartists are eyeing some additional upside price objectives including the 11,075 and 11,175 areas, both of which relate to the pair’s recent high around 13,202.96.
Price activity is nearest the 200-bar MA (4-hourly) at 10,645.88 and the 50-bar MA (Hourly) at 10,246.31.
Technical Support is expected around 10,046.06/ 9,671.29/ 9,442.20 with Stops expected below.
Technical Resistance is expected around 10,810.13/ 11,136.82/ 11,510.44 with Stops expected above.
On 4-Hourly chart, SlowK is Bearishly below SlowD while MACD is Bullishly above MACDAverage.
On 60-minute chart, SlowK is Bearishly below SlowD while MACD is Bearishly below MACDAverage.
Ethereum
Ethereum (ETH/USD) glided lower early in today’s Asian session as the pair traded as low as the 215.94 area after peaking around the 222.77 area during yesterday’s European session, a high that was right around the 50% retracement of the move from 80.60 to 364.49. Given that level’s technical significance, traders are noting that the range’s next upside price objective is around the 256.04 area and the range’s next downside price objective is around the 189.05 area.
The pair continues to hover around the 100-bar MA (hourly), currently indicating around the 216.13 area, and is just above the 50-bar MA (4-hourly) which is currently indicating around the 213.47 level. Also, the pair is now trading between its 50-bar MA (hourly) and 100-bar MA (hourly), with the 100-bar MA (hourly) having just crossed above the 200-bar MA (hourly) in a bullish technical development. Above current market activity, traders are eyeing some technical Resistance around the 228 – 229 levels with some additional selling pressure expected around the 235 – 239 areas.
Price activity is nearest the 100-bar MA (4-hourly) at 216.13 and the 50-bar MA (Hourly) at 216.36.
Technical Support is expected around 206.18/ 197.56 / 191.40 with Stops expected below.
Technical Resistance is expected around 226.56/ 235.31/ 239.20 with Stops expected above.
On 4-Hourly chart, SlowK is Bearishly below SlowD while MACD is Bullishly above MACDAverage.
On 60-minute chart, SlowK is Bearishly below SlowD while MACD is Bearishly below MACDAverage.
